
Image
|
Figure Caption
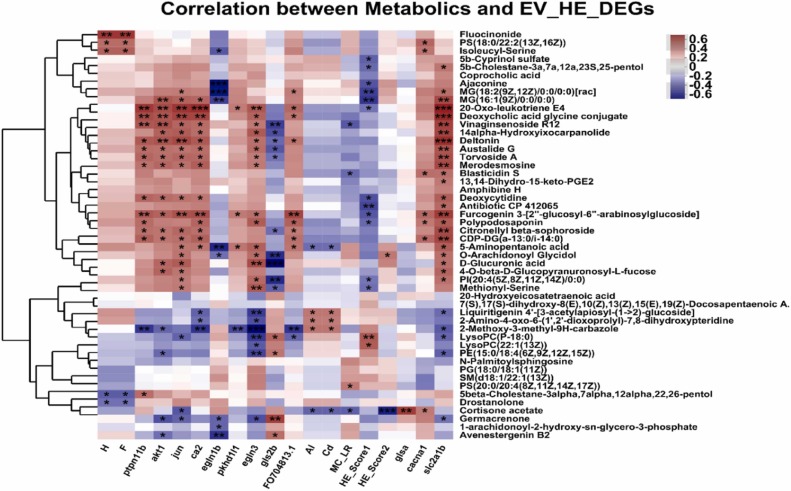
Fig. 3 The correlation analysis of different metabolites and environmental factors, H&E scores, and DEGs in exposed zebrafish. The differently changed metabolites showed their correlation to environmental factors, H&E scores, and screened DEGs from exposed zebrafish transcriptomic profiles. The symbols *, **, and *** presented p<0.05, 0.01, and 0.001 with significant differences between different metabolites and analyzed objects. The red and blue color and values indicated their correlation coefficients.
Acknowledgments
This image is the copyrighted work of the attributed author or publisher, and
ZFIN has permission only to display this image to its users.
Additional permissions should be obtained from the applicable author or publisher of the image.
Full text @ Ecotoxicol. Environ. Saf.