
Image
|
Figure Caption
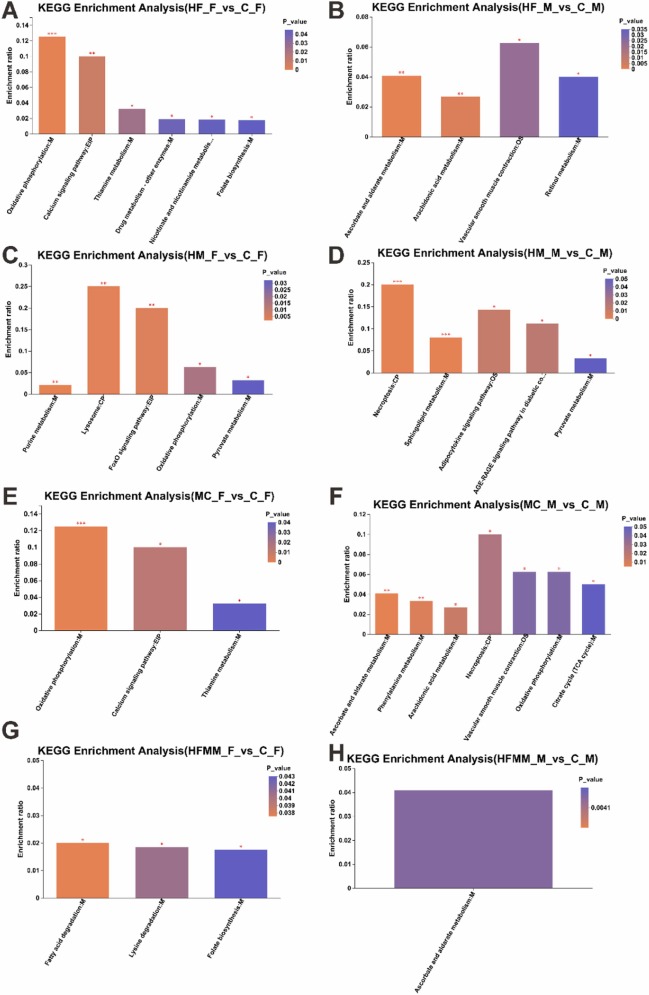
Fig. 4 The KEGG enrichment analysis of zebrafish metabolome after exposure. The enriched KEGG pathways of the HF (A, B), HM (C, D), MC (E, F), and HFMM (G, H) in exposed female and male zebrafish metabolomics profiles. The symbols *, **, and *** presented p<0.05, 0.01, and 0.001 with significant differences between exposure and control groups.
Acknowledgments
This image is the copyrighted work of the attributed author or publisher, and
ZFIN has permission only to display this image to its users.
Additional permissions should be obtained from the applicable author or publisher of the image.
Full text @ Ecotoxicol. Environ. Saf.