
Fig. 5
- ID
- ZDB-FIG-240506-42
- Publication
- Jia et al., 2024 - Metabolome evidence of CKDu risks after chronic exposure to simulated Sri Lanka drinking water in zebrafish
- Other Figures
- All Figure Page
- Back to All Figure Page
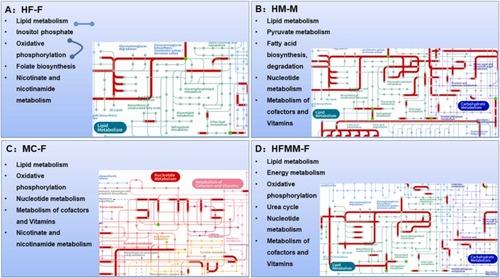
The comprehensive analysis of zebrafish metabolome and transcriptome using the iPath 3.0 (http://pathways.embl.de). (A) The Ipath integrated pathways map of the HF-exposed female zebrafish transcriptome and metabolome. (B) The Ipath integrated pathways map of the HM exposed male zebrafish transcriptome and metabolome. (C) The Ipath integrated pathways map of MC-LR exposed female zebrafish transcriptome and metabolome. (D) The Ipath integrated pathways map of the HFMM-exposed female zebrafish transcriptome and metabolome. The green points stand for the significantly regulated metabolites, and the red lines stand for the DEGs involved in signaling pathways. |