
FIGURE
Fig. 3
- ID
- ZDB-FIG-240506-40
- Publication
- Jia et al., 2024 - Metabolome evidence of CKDu risks after chronic exposure to simulated Sri Lanka drinking water in zebrafish
- Other Figures
- All Figure Page
- Back to All Figure Page
Fig. 3
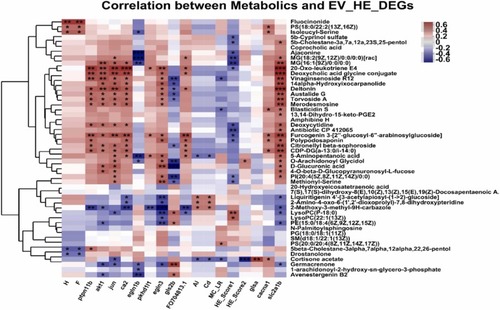
The correlation analysis of different metabolites and environmental factors, H&E scores, and DEGs in exposed zebrafish. The differently changed metabolites showed their correlation to environmental factors, H&E scores, and screened DEGs from exposed zebrafish transcriptomic profiles. The symbols *, **, and *** presented p<0.05, 0.01, and 0.001 with significant differences between different metabolites and analyzed objects. The red and blue color and values indicated their correlation coefficients. |
Expression Data
Expression Detail
Antibody Labeling
Phenotype Data
Phenotype Detail
Acknowledgments
This image is the copyrighted work of the attributed author or publisher, and
ZFIN has permission only to display this image to its users.
Additional permissions should be obtained from the applicable author or publisher of the image.
Full text @ Ecotoxicol. Environ. Saf.