FIGURE SUMMARY
Title

Metformin Attenuates Neutrophil Recruitment through the H3K18 Lactylation/Reactive Oxygen Species Pathway in Zebrafish

Authors
Zhou, R., Ding, R.C., Yu, Q., Qiu, C.Z., Zhang, H.Y., Yin, Z.J., Ren, D.L.
Source
Full text @ Antioxidants (Basel)

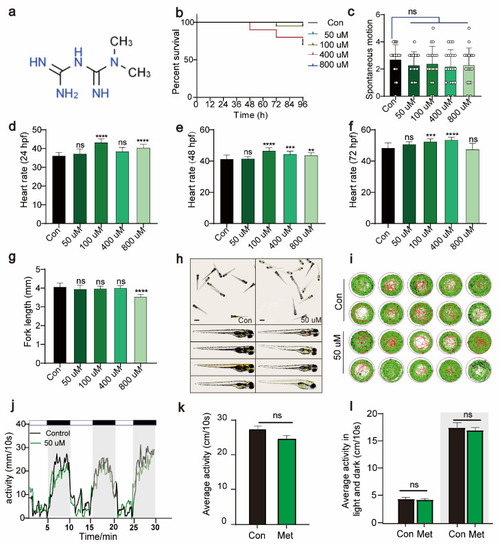
Metformin has no significant effect on the growth, development, or activity of zebrafish larvae. (a) The chemical formula of metformin. (b) Survival rate curve of zebrafish larvae from 0 to 96 hpf (%survival, n = 15). (c) Tail swing frequency of 30 hpf zebrafish larvae (swing per minute, n = 15). (d) Heartbeat of 24 hpf zebrafish larvae (beats per minute, n = 30). (e) Heartbeat of 48 hpf zebrafish larvae (beats per minute, n = 30). (f) Heartbeat of 24 hpf zebrafish larvae (beats per minute, n = 30). (g) Statistical graph of the fork length of 96 hpf zebrafish larvae (mm, n = 15). (h) Morphological images of 96 hpf zebrafish larvae observed under a stereomicroscope (scale bar: 350 μm). There were no significant differences in morphology between the 50 μM metformin-treated group and the control group. The data were analyzed using one-way ANOVA and the log-rank test. All the experiments were repeated three times. (i,j) The behavioral rhythms of the control group (n = 10/group) and the 50 μM metformin group (n = 10/group) after 3 days were observed under conditions of 14 h of light and 10 h of alternating darkness (LD). (k) The behavioral rhythms of the Con group (n = 10/group) and Met group (n = 10/group) were observed on day 3 under continuous light (LL) conditions. (l) The 30 min behavioral rhythms of the Con group (n = 10/group) and Met group (n = 10/group) were observed under continuous light (LL) and continuous darkness (LD) conditions. (**** p  <  0.0001, *** p  <  0.001, ** p  <  0.01, “ns”, no statistical difference).

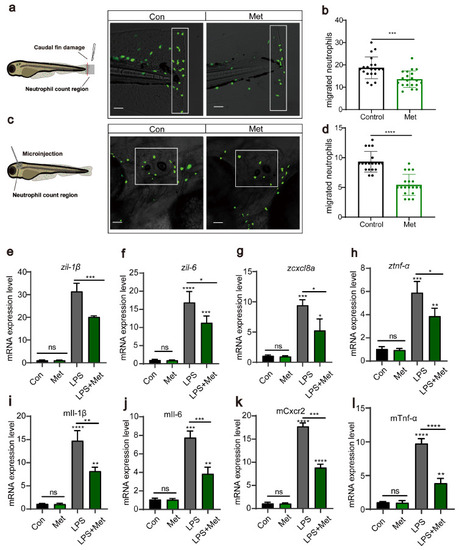
Metformin reduces the recruitment of neutrophils to inflammatory sites. (a,c) Pattern diagrams showing the caudal fin damage model and otic vesicle inflammation model in zebrafish infected with the Tg(lyz:EGFP) strain. Fluorescence images showing migrating neutrophils. The white rectangles indicate the counting area (scale bar: 200 μm). (b,d) Statistical analysis showed that the number of neutrophils recruited to the injury site was significantly lower in the larvae-fed metformin (n = 20). (eh) Q-PCR analysis showed that the expression levels of the inflammation-related genes il-1β, il-6, cxcl8a, and tnf-α were significantly downregulated after metformin treatment in juvenile fish. (il) Q-PCR analysis showed that the expression levels of the inflammation-related genes il-1β, il-6, cxcl8a, and tnf-α in murine macrophages under metformin conditions were significantly downregulated. (**** p < 0.0001, *** p < 0.001, ** p  <  0.01, * p  <  0.05, “ns”, no statistical difference).

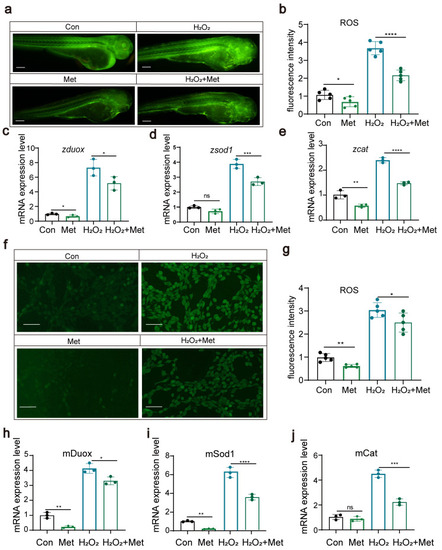
Metformin can reduce reactive oxygen species levels in zebrafish and cells (a,b). The results of fluorescence staining showed that metformin downregulated the level of ROS in zebrafish and that H2O2 upregulated the level of ROS (scale bar: 200 μm). The addition of metformin alleviated the effect of H2O2 on reactive oxygen species in zebrafish (n = 25). (ce) Q-PCR results showing that metformin treatment reduced the upregulation of H2O2-induced expression of duox, sod1, and cat in zebrafish. (f,g) Fluorescence staining results showing that metformin downregulated ROS and that H2O2 upregulated ROS in murine macrophages. The addition of metformin alleviated the effect of H2O2 on reactive oxygen species in murine macrophages. (hj) Q-PCR results showing that metformin treatment reduced the upregulation of H2O2-induced expression of duox, sod1, and cat in murine macrophages. (**** p  <  0.0001, *** p  <  0.001, ** p  <  0.01, * p  <  0.05, “ns”, no statistical difference).

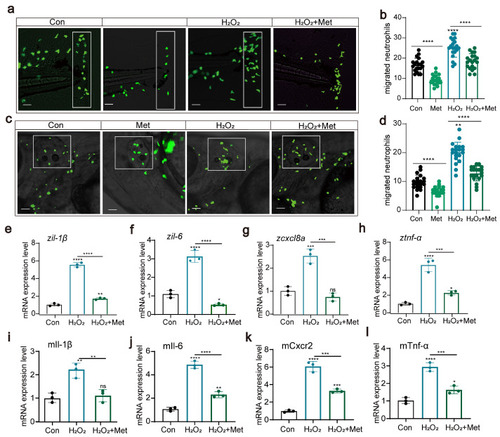
Reactive oxygen species can affect neutrophil migration and immune function (ad) Pattern diagrams showing the caudal fin damage model and otic vesicle inflammation model using zebrafish from the Tg(lyz:EGFP) strain. Fluorescence images showing migrating neutrophils. The white rectangles indicate the counting area (scale bar: 200 μm). H2O2 treatment significantly increased neutrophil recruitment to the injury site, and metformin mitigated this effect (n = 20). (eh) Q-PCR results showing that metformin treatment decreased the upregulation of the inflammatory genes il-1β, il-6, cxcl8a, and tnf-α induced by H2O2 in juvenile zebrafish. (il) Q-PCR results showed that metformin treatment decreased the upregulation of the inflammatory genes il-1β, il-6, cxcl8a, and tnf-α induced by H2O2 in murine macrophages. (**** p  <  0.0001, *** p  <  0.001, ** p  <  0.01, * p  <  0.05, “ns”, no statistical difference).

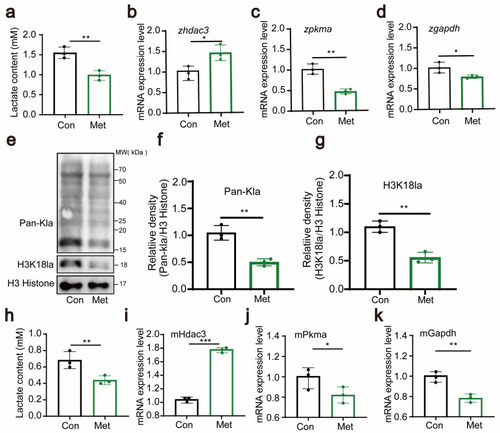
Metformin downregulates H3K18 lactylation. (a) Lactate levels in zebrafish larvae significantly decreased after treatment with metformin. (bd) Q-PCR analysis showed that the lactate metabolism-related gene hdac3 was significantly upregulated and that the expression levels of pkma and gapdh were significantly downregulated in zebrafish larvae after metformin treatment. (eg) Western blotting results showed that the levels of histone lactylation and histone lactylation (H3K18) were significantly reduced in zebrafish larvae after metformin treatment. (h) Lactate levels in murine macrophages significantly decreased after treatment with metformin. (ik) Q-PCR analysis showed that the lactate metabolism-related gene hdac3 was significantly upregulated and that the expression levels of pkma and gapdh were significantly reduced in murine macrophages after metformin treatment. (*** p  <  0.001, ** p  <  0.01, * p  <  0.05).

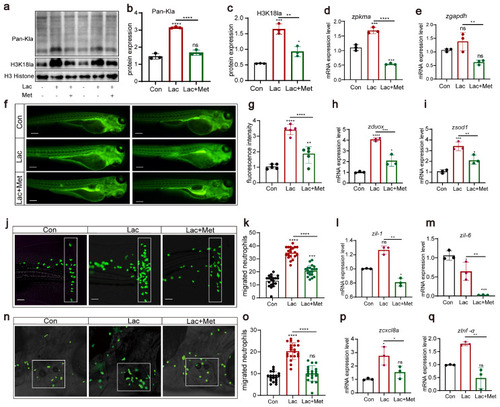
H3K18 lactylation affects neutrophil recruitment by increasing the levels of reactive oxygen species (ac) Western blotting results showed that the levels of histone lactylation and histone lactation (H3K18) in zebrafish larvae after lactic acid treatment were significantly increased, and this lactate-induced upregulation was effectively inhibited when lactic acid was combined with metformin. (d,e) Q-PCR results showed that the levels of the pkma and gapdh genes related to lactic acid metabolism were significantly increased after lactic acid treatment, and this lactate-induced upregulation was effectively inhibited when lactic acid was combined with metformin. (f,g) Fluorescence staining results showing that lactic acid upregulated ROS levels in zebrafish. The addition of metformin alleviated the effect of hydrogen peroxide on reactive oxygen species in zebrafish (n = 25). (h,i) Q-PCR results showing that metformin treatment decreased the upregulation of dox and sod1 in lactate-induced zebrafish. (j,k,n,o) Pattern diagrams showing the caudal fin damage model and otic vesicle inflammation model generated from zebrafish infected with the Tg(lyz:EGFP) strain. Fluorescence images showing migrating neutrophils. The white rectangles indicate the counting area (scale bar: 200 μm). Lactic acid treatment significantly increased neutrophil recruitment to the injury site, and metformin mitigated this effect (n = 20). (l,m,p,q) Q-PCR results showing that metformin treatment decreased the upregulation of the inflammatory genes il-1β, il-6, cxcl8a, and tnf-α induced by lactic acid in juvenile zebrafish. (**** p  <  0.0001, *** p  <  0.001, ** p  <  0.01, * p  <  0.05, “ns”, no statistical difference).

Acknowledgments
This image is the copyrighted work of the attributed author or publisher, and ZFIN has permission only to display this image to its users. Additional permissions should be obtained from the applicable author or publisher of the image. Full text @ Antioxidants (Basel)