
- Title
-
Recording physiological history of cells with chemical labeling
- Authors
- Huppertz, M.C., Wilhelm, J., Grenier, V., Schneider, M.W., Falt, T., Porzberg, N., Hausmann, D., Hoffmann, D.C., Hai, L., Tarnawski, M., Pino, G., Slanchev, K., Kolb, I., Acuna, C., Fenk, L.M., Baier, H., Hiblot, J., Johnsson, K.
- Source
- Full text @ Science
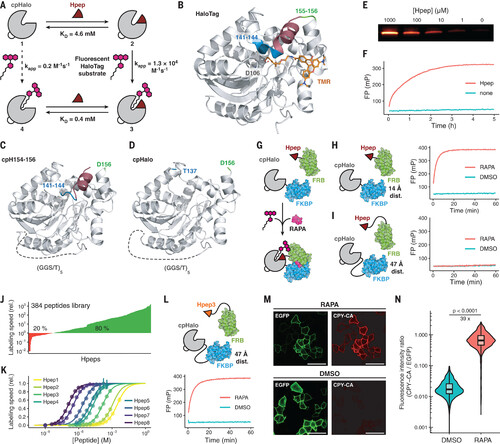
Split-HaloTag characterization and application as a recorder of protein-protein interactions. (A) Scheme of the split-HaloTag system. Binding of Hpep to cpHalo increases labeling speed 26,000-fold. Numbers correspond to reaction with the fluorescent tetramethylrhodamine HaloTag substrate (TMR-CA). kapp, apparent second-order rate constant. (B) X-ray structure of HaloTag labeled with TMR-CA [Protein Data Bank (PDB) ID 6Y7A]. Positions of the new termini of the circularly permuted HaloTag are highlighted in blue and green. The segment corresponding to Hpep1 is highlighted in red. D, Asp. (C and D) X-ray structures of cpHaloTag154-156 (cpH154-156; PDB ID 8B6P) and cpHalo∆ (PDB ID 8B6N). Both proteins display the same overall fold as HaloTag. T, Thr. (E) Hpep-dependency of cpHalo∆ (1 μM) labeling with TMR-CA (2 μM) analyzed by SDS-PAGE (SDS–polyacrylamide gel electrophoresis). (F) Labeling kinetics of split-HaloTag (500 nM, cpHalo∆) with TMR-CA (50 nM) in presence or absence of Hpep (250 μM) measured by fluorescence polarization (FP). (G) Detection of the rapamycin-dependent interaction of FKBP and FRB with split-HaloTag. (H) Labeling kinetics of FKBP-(GGS)-cpHalo∆ (250 nM) and FRB-(GGS)-Hpep1 (250 nM) (14-Å distance between FKBP and FRB C termini) with TMR-CA (50 nM) as measured by FP. Split-HaloTag labels itself only in the presence of rapamycin (RAPA; 500 nM). DMSO, dimethyl sulfoxide. (I) Labeling kinetics of cpHalo∆-(GGS)9-FKBP (250 nM) and Hpep1-(GGS)3-FRB (250 nM) (47-Å distance between FKBP and FRB N termini) with TMR-CA (50 nM) in the presence or absence of rapamycin (500 nM) as measured by FP. (J) Screening of 384 Rosetta-designed Hpep variants reveals a large number of highly active hits. Labeling rates with TMR-CA (100 nM) in the presence of cpHalo∆ (500 nM) are given relative to the labeling rate of the original Hpep1. (K) Titrations of eight selected Hpeps with EC50 values ranging from high nanomolar (EC50Hpep8: 124 nM) to low millimolar (EC50Hpep1: 3.0 mM). (L) Labeling kinetics of cpHalo∆-(GGS)9-FKBP (250 nM) and Hpep3-(GGS)3-FRB (250 nM) (47 Å distance between FKBP and FRB N termini) with TMR-CA (50 nM) in the presence or absence of rapamycin (500 nM) as measured by FP. (M) Fluorescence micrographs of HeLa cells coexpressing Lyn11-EGFP-cpHalo∆-(GGS)9-FKBP and Hpep3-(GGS)3-FRB-mScarlet. Labeling with CPY-CA (100 nM, 1 hour) is observed only in the presence of rapamycin (100 nM). Scale bars are 50 μm. (N) Flow cytometry analysis of HeLa cells coexpressing Lyn11-EGFP-cpHalo∆-(GGS)9-FKBP and Hpep3-(GGS)3-FRB-mScarlet incubated with CPY-CA (100 nM, 1 hour) in the presence or absence of rapamycin (100 nM). The presence of rapamycin leads to a 39-fold higher median labeling ratio (CPY-CA/EGFP) (N > 1900 cells; p < 0.0001; Welch’s t test). The center line represents the median, box limits are upper and lower quartiles, and whiskers are minimum and maximum values. |
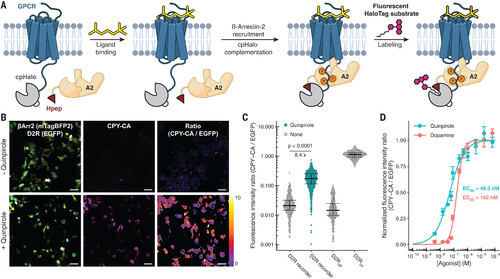
Recording of GPCR signaling using split-HaloTag. (A) Scheme of split-HaloTag–based GPCR recorder. Fusion of Hpep to βArr2 and cpHaloΔ to a GPCR leads to labeling of split-HaloTag after ligand binding and downstream βArr2 recruitment. (B) Fluorescence micrographs of human embryonic kidney (HEK) 293 cells coexpressing Hpep1-βArr2-T2A-mTagBFP2 and D2R-cpHaloΔ-GGS-EGFP treated with or without quinpirole (100 μM, 1 hour) in the presence of CPY-CA (200 nM). The color scale bar represents the ratio of fluorescence intensities. Scale bars are 50 μm. (C) Quantification of D2R-cpHaloΔ-EGFP labeling (N > 500 cells; p < 0.0001; Welch’s t test). Error bars indicate median and 25 and 75% quantiles. D2Roff, D2R lacking cpHaloΔ; D2Ron, D2R fused to cpHaloTag154-156. (D) Labeling of HEK293 cells coexpressing D2R-cpHaloΔ and Hpep-βArr2 in the presence of varying concentrations of dopamine or quinpirole. Data are shown as mean ± SEM. A sigmoidal model was applied to determine EC50 values. |
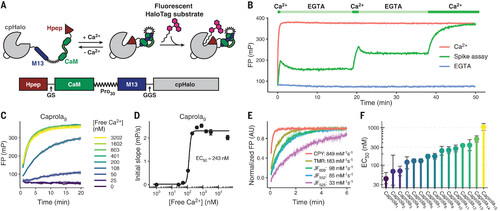
Design and characterization of the Ca2+ recorder Caprola. (A) Scheme of Caprola design. GS, Gly-Ser; Pro30, 30 Pro; GGS, Gly-Gly-Ser. (B) In vitro labeling kinetics of Caprola9 measured by FP. Caprola9 (200 nM) shows fast labeling kinetics with TMR-CA (50 nM) in the presence of Ca2+ (5 mM) and low background activity in the presence of Ca2+-chelator EGTA (100 μM) and can be repeatedly activated and deactivated by successive additions of Ca2+ and EGTA, respectively. (C) Labeling kinetics of Caprola9 (200 nM) with TMR-CA (50 nM) at different free-Ca2+ concentrations measured by FP. (D) Ca2+ sensitivity of Caprola9 determined by plotting free-Ca2+ concentrations against the initial slopes of the labeling reactions from (C). The EC50 represents the calcium concentration at which Caprola9 shows half of its maximum labeling speed. (E) Labeling kinetics and apparent second-order rate constants of Caprola9 (200 nM) with different fluorescent substrates (50 nM) in the presence of Ca2+ (5 mM). FP values were normalized to their unbound and fully bound values (normalized FP). AU, arbitrary units. (F) Ca2+ sensitivity (EC50 values) of the 15 Caprola variants as determined in (D). Values range from 44 to 1050 nM. Error bars represent 95% confidence intervals. |
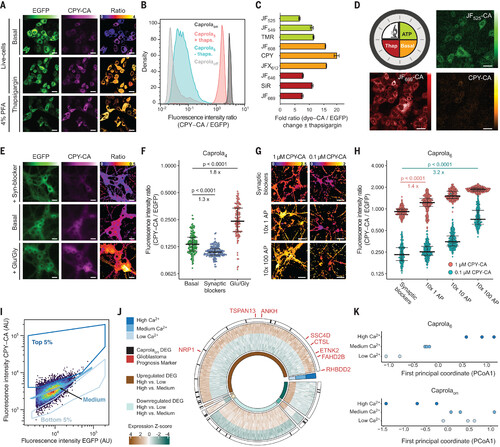
Recording calcium signaling using Caprola. (A) Fluorescence micrographs of HeLa cells expressing Caprola5-EGFP and incubated with CPY-CA (100 nM) in the presence or absence of thapsigargin (100 nM, 1 hour). Live and chemically fixed cells are shown. Ratio indicates CPY-CA/EGFP. (B) Flow cytometry analysis of HeLa cells expressing Caprola5-EGFP, Caprolaon-EGFP, or Caprolaoff-EGFP incubated with CPY-CA (100 nM, 1 hour) in the presence or absence of thapsigargin (100 nM) (N > 10,000 cells). (C) Flow cytometry analysis of HeLa cells expressing Caprola5-EGFP incubated with different fluorescent substrates (100 nM, 1 hour) in the presence or absence of thapsigargin (100 nM) (N > 10,000 cells). Error bars represent SEM. (D) Recording of three successive periods of Ca2+-activity in HeLa cells expressing Caprola5-EGFP. First period: ATP (100 μM) and JF525-CA (300 nM, 1 hour); second period: no treatment and CPY-CA (25 nM, 1 hour); third period: thapsigargin (Thap; 100 nM) and JF669-CA (300 nM, 1 hour). Between incubations, cells were allowed to recover for 2 hours. Fluorescence micrographs were acquired after the three recording periods. (E) Fluorescence micrographs of primary rat hippocampal neurons expressing Caprola4-EGFP labeled with CPY-CA (250 nM, 30 min) in the presence of synaptic blockers APV/NBQX (25 μM/10 μM) or glutamate/glycine (Glu/Gly; 10 μM/2.5 μM) or without treatment. Ratio indicates CPY-CA/EGFP. (F) Quantification of Caprola4 labeling from experiments described in (E) (N > 100 cells). The center line indicates the median, and error bars indicate 25 and 75% quantiles. (G) Ratiometric fluorescence micrographs (CPY-CA/EGFP) of primary rat hippocampal neurons expressing Caprola6-EGFP incubated with CPY-CA (1 or 0.1 μM, 30-min preincubation, 1-hour stimulation) upon defined electrical field stimulation. Action potentials (APs) were delivered in 10 short pulses (80 Hz) over the course of 1 hour interspaced with resting periods (approximately 7 min). (H) Quantification of Caprola6 labeling from experiments described in (G) (N > 100 cells). The center line indicates the median, and error bars indicate 25 and 75% quantiles. (I) Gating strategy of CPY-labeled (125 nM, 90 min) glioblastoma cells expressing Caprola6-EGFP for later RNA-seq analysis. (J) Transcriptional profiles of the three sorted groups from (I). DEGs identified by RNA-seq analysis are color coded according to Z-scores. DEGs were arranged in six groups according to their pairwise comparison pattern (e.g., up-regulated high versus low and high versus medium; inner circle). Glioblastoma prognosis markers are indicated in red, and DEGs identified in both Caprola6 and Caprolaon experiments are highlighted as black lines (outer circle). (K) Dot plots of the first principal coordinate analysis from Caprola6-EGFP– and Caprolaon-EGFP–expressing glioblastoma cells. Statistical significances in panels (F) and (H) were calculated with Welch’s t test, and p values are given for each comparison. In (A), (D), (E), and (G), color scale bars represent either fluorescence intensities or ratios, and scale bars are 20 μm. |
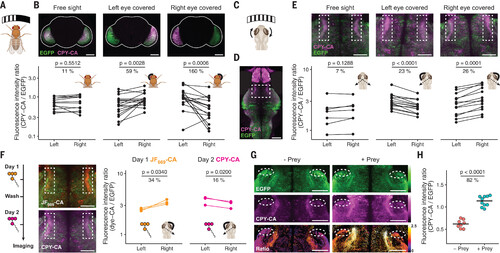
Recording of neuronal calcium signaling in vivo. (A) Cartoon of the experimental setup for visual stimulation of flies. A curved monitor was positioned in front of adult flies expressing Caprola5-EGFP to stimulate both or only one of the eyes using moving sine wave gratings. (B) Asymmetrical visual stimulation of flies recorded with Caprola5-EGFP in presence of CPY-CA (5 μM, 20 min). Representative fluorescence micrographs for each condition and pair plots of mean ratios (CPY-CA/EGFP) of left and right lobes are shown (N ≥ 12 individuals per condition). The shape of the whole brain is outlined in white. (C) Cartoon of the experimental setup for visual stimulation of zebrafish larvae. Black-and-white gratings, moving in both horizontal directions in front of the agarose-embedded larvae, evoke optokinetic eye movements (indicated by curved arrows). (D) Fluorescence micrograph of a zebrafish larva brain expressing Caprola1-EGFP labeled with CPY-CA (5 μM, 6 hours) during visual stimulation (maximum intensity projection). The white box indicates the region of interest containing the AF9. Fluorescent signal from the zebrafish’s eyes was removed. (E) Asymmetrical visual stimulation of zebrafish larvae recorded with Caprola1-EGFP. Individual eyes of larvae were occluded or left unobstructed during visual stimulation in presence of CPY-CA (5 μM, 6 hours). Representative fluorescence micrographs of AF9 (white boxes) are shown. Pair plots of mean ratios (CPY-CA/EGFP) from AF9 regions are shown for each condition (N ≥ 7 larvae per condition). (F) Sequential recordings of asymmetrical visual stimulation from AF9 on two consecutive days using Caprola1-EGFP with JF669-CA (5 μM, 6 hours) and CPY-CA (5 μM, 6 hours), respectively. Fluorescence micrographs of AF9 (white boxes) were acquired after the two recording periods. Pair plots of mean ratios (JF669-CA/EGFP and CPY-CA/EGFP) from AF9 are shown for both fluorescent substrates (N = 3 larvae per condition). (G) Freely swimming zebrafish larvae expressing Caprola1-EGFP labeled with CPY-CA (5 μM, 2 hours) in the presence or absence of prey (paramecia). Fluorescence micrographs of AF7 (white ovals) are shown. Ratio indicates CPY-CA/EGFP. Color scale bars represent either fluorescence intensities or ratios. (H) Dot plots of mean ratios from AF7 are shown (N ≥ 4 larvae per condition). Statistical significances in (B), (E), (F), and (H) were calculated with one-tailed Welch’s t test (or two-tailed for symmetric stimulation), and p values are given for each comparison. Pair-plots percentages indicate the mean ratio increase from the lower to the higher condition. Scale bars are 100 μm [(B) and (D)] and 50 μm [(E) to (G)]. |