
|
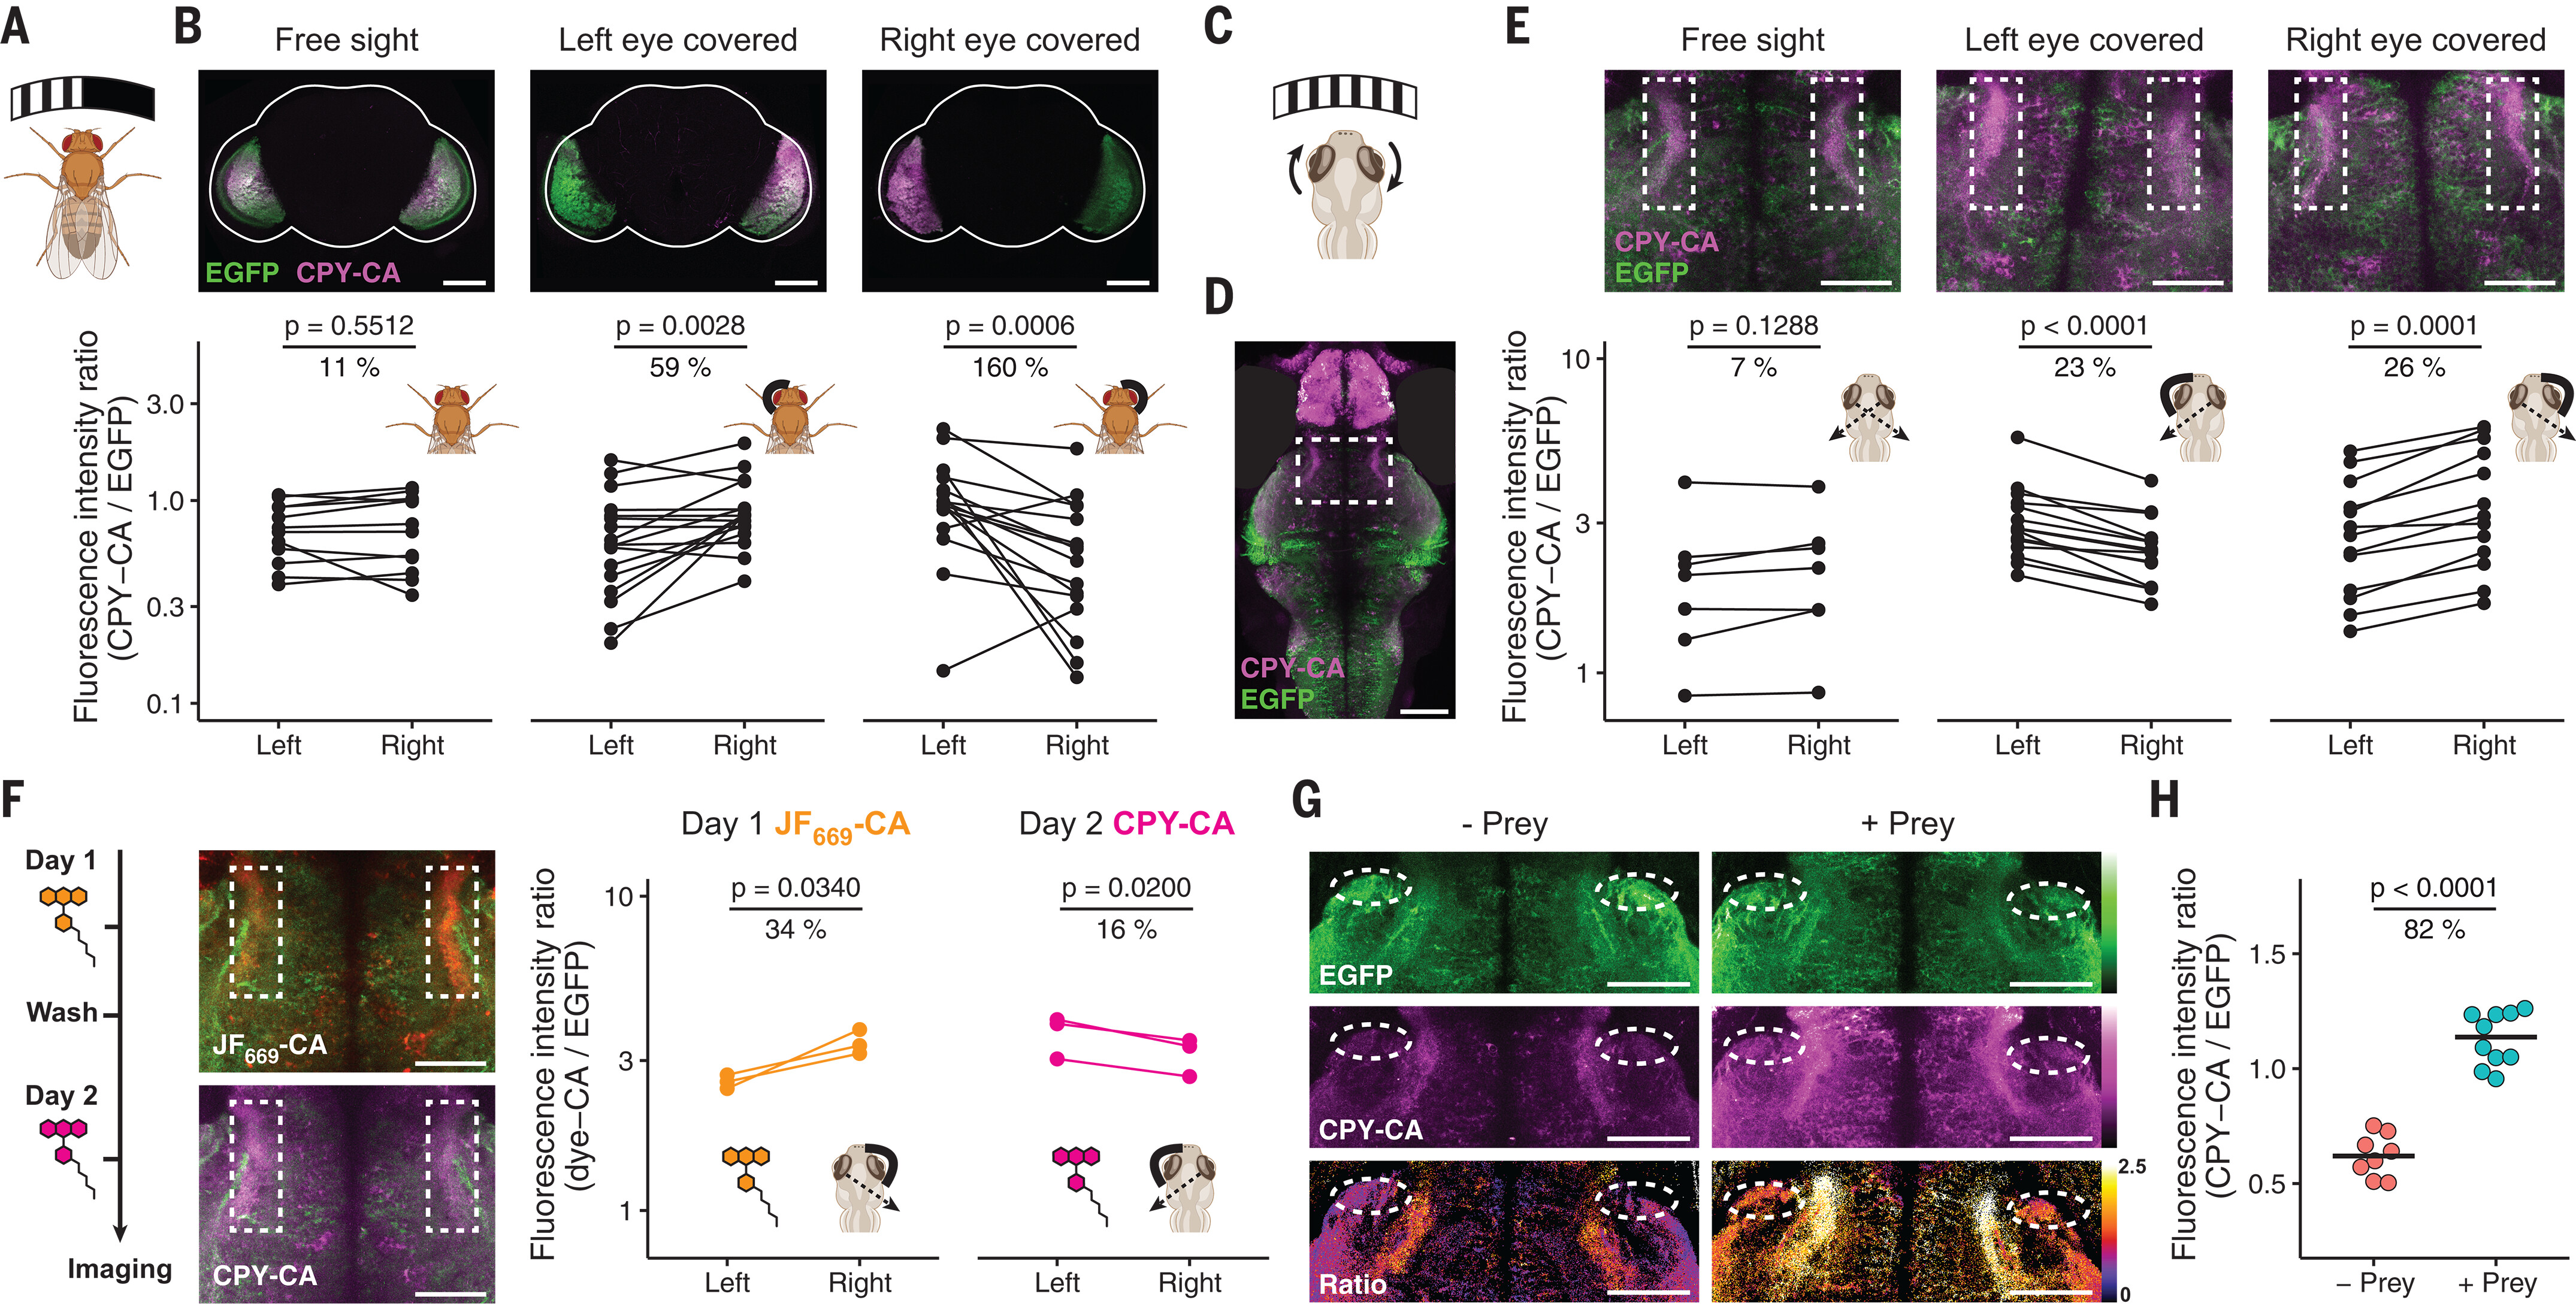
Fig. 5 Recording of neuronal calcium signaling in vivo. (A) Cartoon of the experimental setup for visual stimulation of flies. A curved monitor was positioned in front of adult flies expressing Caprola5-EGFP to stimulate both or only one of the eyes using moving sine wave gratings. (B) Asymmetrical visual stimulation of flies recorded with Caprola5-EGFP in presence of CPY-CA (5 μM, 20 min). Representative fluorescence micrographs for each condition and pair plots of mean ratios (CPY-CA/EGFP) of left and right lobes are shown (N ≥ 12 individuals per condition). The shape of the whole brain is outlined in white. (C) Cartoon of the experimental setup for visual stimulation of zebrafish larvae. Black-and-white gratings, moving in both horizontal directions in front of the agarose-embedded larvae, evoke optokinetic eye movements (indicated by curved arrows). (D) Fluorescence micrograph of a zebrafish larva brain expressing Caprola1-EGFP labeled with CPY-CA (5 μM, 6 hours) during visual stimulation (maximum intensity projection). The white box indicates the region of interest containing the AF9. Fluorescent signal from the zebrafish’s eyes was removed. (E) Asymmetrical visual stimulation of zebrafish larvae recorded with Caprola1-EGFP. Individual eyes of larvae were occluded or left unobstructed during visual stimulation in presence of CPY-CA (5 μM, 6 hours). Representative fluorescence micrographs of AF9 (white boxes) are shown. Pair plots of mean ratios (CPY-CA/EGFP) from AF9 regions are shown for each condition (N ≥ 7 larvae per condition). (F) Sequential recordings of asymmetrical visual stimulation from AF9 on two consecutive days using Caprola1-EGFP with JF669-CA (5 μM, 6 hours) and CPY-CA (5 μM, 6 hours), respectively. Fluorescence micrographs of AF9 (white boxes) were acquired after the two recording periods. Pair plots of mean ratios (JF669-CA/EGFP and CPY-CA/EGFP) from AF9 are shown for both fluorescent substrates (N = 3 larvae per condition). (G) Freely swimming zebrafish larvae expressing Caprola1-EGFP labeled with CPY-CA (5 μM, 2 hours) in the presence or absence of prey (paramecia). Fluorescence micrographs of AF7 (white ovals) are shown. Ratio indicates CPY-CA/EGFP. Color scale bars represent either fluorescence intensities or ratios. (H) Dot plots of mean ratios from AF7 are shown (N ≥ 4 larvae per condition). Statistical significances in (B), (E), (F), and (H) were calculated with one-tailed Welch’s t test (or two-tailed for symmetric stimulation), and p values are given for each comparison. Pair-plots percentages indicate the mean ratio increase from the lower to the higher condition. Scale bars are 100 μm [(B) and (D)] and 50 μm [(E) to (G)].