
Fig. 2
- ID
- ZDB-FIG-240419-82
- Publication
- Huppertz et al., 2024 - Recording physiological history of cells with chemical labeling
- Other Figures
- All Figure Page
- Back to All Figure Page
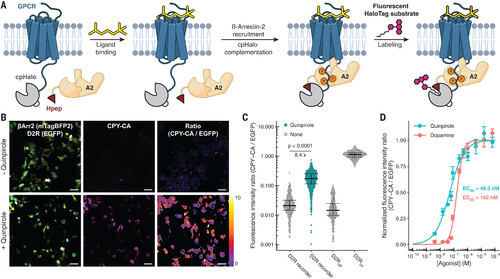
Recording of GPCR signaling using split-HaloTag. (A) Scheme of split-HaloTag–based GPCR recorder. Fusion of Hpep to βArr2 and cpHaloΔ to a GPCR leads to labeling of split-HaloTag after ligand binding and downstream βArr2 recruitment. (B) Fluorescence micrographs of human embryonic kidney (HEK) 293 cells coexpressing Hpep1-βArr2-T2A-mTagBFP2 and D2R-cpHaloΔ-GGS-EGFP treated with or without quinpirole (100 μM, 1 hour) in the presence of CPY-CA (200 nM). The color scale bar represents the ratio of fluorescence intensities. Scale bars are 50 μm. (C) Quantification of D2R-cpHaloΔ-EGFP labeling (N > 500 cells; p < 0.0001; Welch’s t test). Error bars indicate median and 25 and 75% quantiles. D2Roff, D2R lacking cpHaloΔ; D2Ron, D2R fused to cpHaloTag154-156. (D) Labeling of HEK293 cells coexpressing D2R-cpHaloΔ and Hpep-βArr2 in the presence of varying concentrations of dopamine or quinpirole. Data are shown as mean ± SEM. A sigmoidal model was applied to determine EC50 values. |