
|
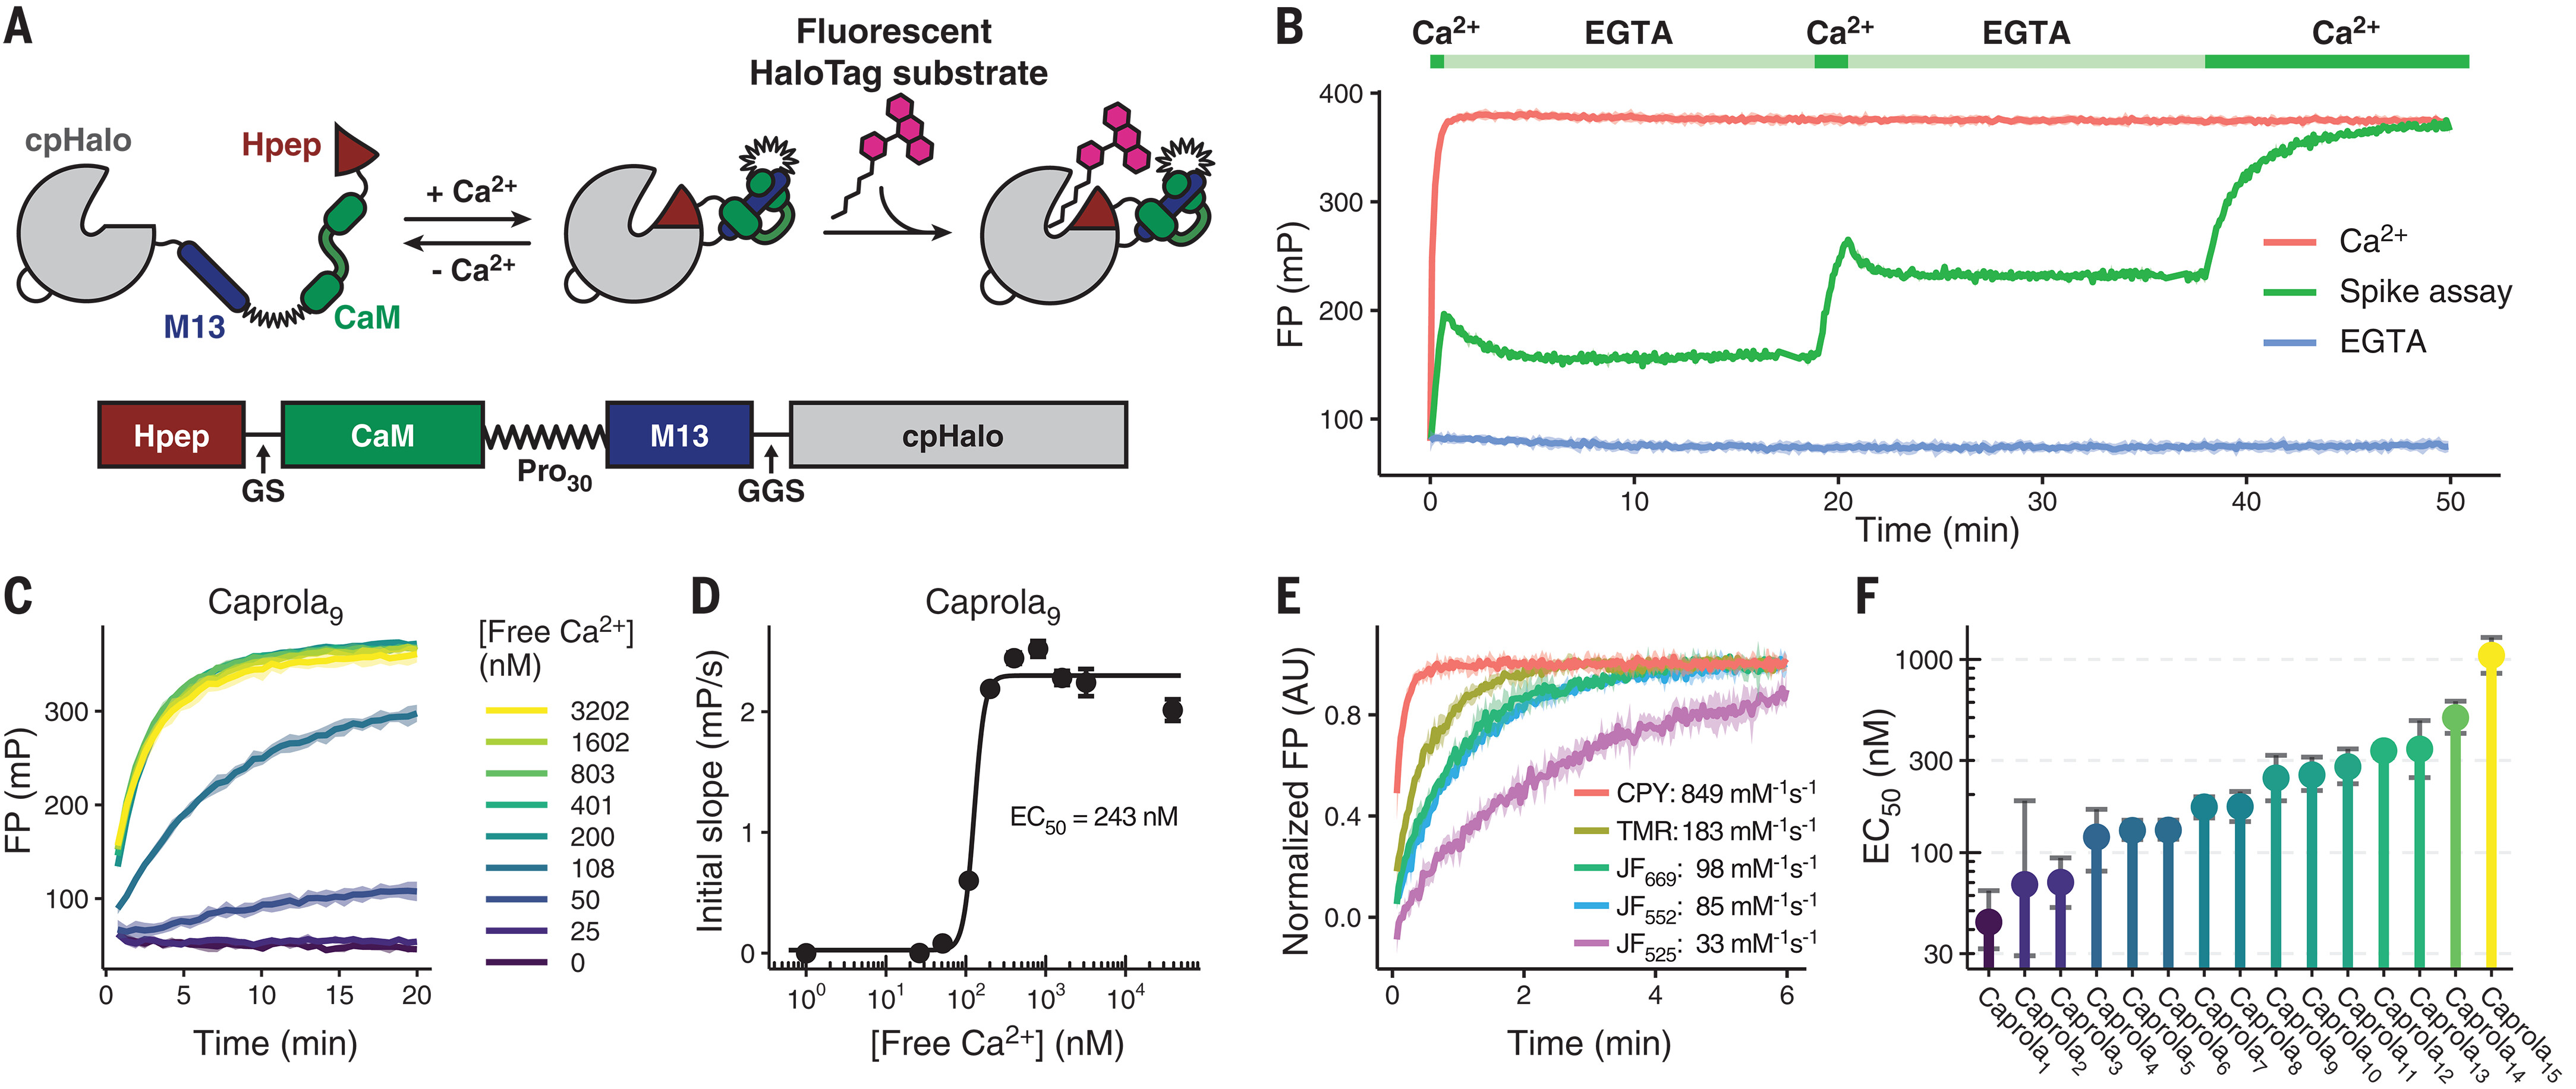
Fig. 3 Design and characterization of the Ca2+ recorder Caprola. (A) Scheme of Caprola design. GS, Gly-Ser; Pro30, 30 Pro; GGS, Gly-Gly-Ser. (B) In vitro labeling kinetics of Caprola9 measured by FP. Caprola9 (200 nM) shows fast labeling kinetics with TMR-CA (50 nM) in the presence of Ca2+ (5 mM) and low background activity in the presence of Ca2+-chelator EGTA (100 μM) and can be repeatedly activated and deactivated by successive additions of Ca2+ and EGTA, respectively. (C) Labeling kinetics of Caprola9 (200 nM) with TMR-CA (50 nM) at different free-Ca2+ concentrations measured by FP. (D) Ca2+ sensitivity of Caprola9 determined by plotting free-Ca2+ concentrations against the initial slopes of the labeling reactions from (C). The EC50 represents the calcium concentration at which Caprola9 shows half of its maximum labeling speed. (E) Labeling kinetics and apparent second-order rate constants of Caprola9 (200 nM) with different fluorescent substrates (50 nM) in the presence of Ca2+ (5 mM). FP values were normalized to their unbound and fully bound values (normalized FP). AU, arbitrary units. (F) Ca2+ sensitivity (EC50 values) of the 15 Caprola variants as determined in (D). Values range from 44 to 1050 nM. Error bars represent 95% confidence intervals.