
Fig. 1
- ID
- ZDB-FIG-240419-81
- Publication
- Huppertz et al., 2024 - Recording physiological history of cells with chemical labeling
- Other Figures
- All Figure Page
- Back to All Figure Page
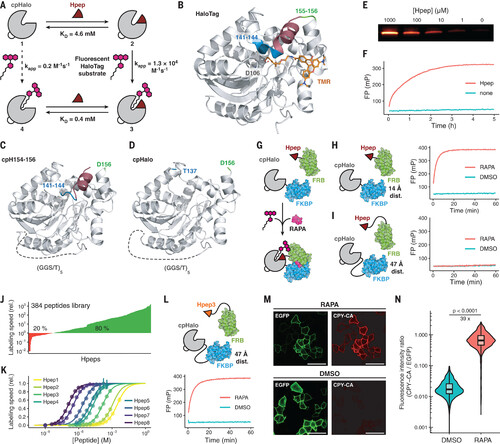
Split-HaloTag characterization and application as a recorder of protein-protein interactions. (A) Scheme of the split-HaloTag system. Binding of Hpep to cpHalo increases labeling speed 26,000-fold. Numbers correspond to reaction with the fluorescent tetramethylrhodamine HaloTag substrate (TMR-CA). kapp, apparent second-order rate constant. (B) X-ray structure of HaloTag labeled with TMR-CA [Protein Data Bank (PDB) ID 6Y7A]. Positions of the new termini of the circularly permuted HaloTag are highlighted in blue and green. The segment corresponding to Hpep1 is highlighted in red. D, Asp. (C and D) X-ray structures of cpHaloTag154-156 (cpH154-156; PDB ID 8B6P) and cpHalo∆ (PDB ID 8B6N). Both proteins display the same overall fold as HaloTag. T, Thr. (E) Hpep-dependency of cpHalo∆ (1 μM) labeling with TMR-CA (2 μM) analyzed by SDS-PAGE (SDS–polyacrylamide gel electrophoresis). (F) Labeling kinetics of split-HaloTag (500 nM, cpHalo∆) with TMR-CA (50 nM) in presence or absence of Hpep (250 μM) measured by fluorescence polarization (FP). (G) Detection of the rapamycin-dependent interaction of FKBP and FRB with split-HaloTag. (H) Labeling kinetics of FKBP-(GGS)-cpHalo∆ (250 nM) and FRB-(GGS)-Hpep1 (250 nM) (14-Å distance between FKBP and FRB C termini) with TMR-CA (50 nM) as measured by FP. Split-HaloTag labels itself only in the presence of rapamycin (RAPA; 500 nM). DMSO, dimethyl sulfoxide. (I) Labeling kinetics of cpHalo∆-(GGS)9-FKBP (250 nM) and Hpep1-(GGS)3-FRB (250 nM) (47-Å distance between FKBP and FRB N termini) with TMR-CA (50 nM) in the presence or absence of rapamycin (500 nM) as measured by FP. (J) Screening of 384 Rosetta-designed Hpep variants reveals a large number of highly active hits. Labeling rates with TMR-CA (100 nM) in the presence of cpHalo∆ (500 nM) are given relative to the labeling rate of the original Hpep1. (K) Titrations of eight selected Hpeps with EC50 values ranging from high nanomolar (EC50Hpep8: 124 nM) to low millimolar (EC50Hpep1: 3.0 mM). (L) Labeling kinetics of cpHalo∆-(GGS)9-FKBP (250 nM) and Hpep3-(GGS)3-FRB (250 nM) (47 Å distance between FKBP and FRB N termini) with TMR-CA (50 nM) in the presence or absence of rapamycin (500 nM) as measured by FP. (M) Fluorescence micrographs of HeLa cells coexpressing Lyn11-EGFP-cpHalo∆-(GGS)9-FKBP and Hpep3-(GGS)3-FRB-mScarlet. Labeling with CPY-CA (100 nM, 1 hour) is observed only in the presence of rapamycin (100 nM). Scale bars are 50 μm. (N) Flow cytometry analysis of HeLa cells coexpressing Lyn11-EGFP-cpHalo∆-(GGS)9-FKBP and Hpep3-(GGS)3-FRB-mScarlet incubated with CPY-CA (100 nM, 1 hour) in the presence or absence of rapamycin (100 nM). The presence of rapamycin leads to a 39-fold higher median labeling ratio (CPY-CA/EGFP) (N > 1900 cells; p < 0.0001; Welch’s t test). The center line represents the median, box limits are upper and lower quartiles, and whiskers are minimum and maximum values. |