
Fig. 4
- ID
- ZDB-FIG-240419-84
- Publication
- Huppertz et al., 2024 - Recording physiological history of cells with chemical labeling
- Other Figures
- All Figure Page
- Back to All Figure Page
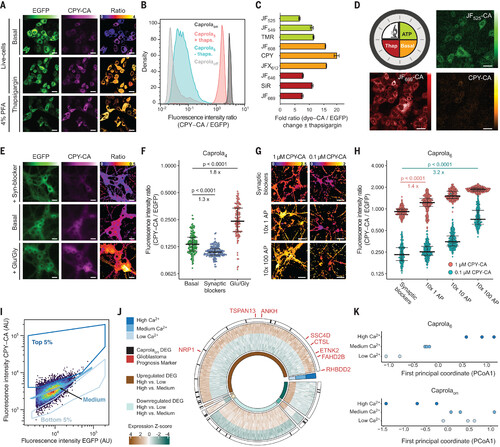
Recording calcium signaling using Caprola. (A) Fluorescence micrographs of HeLa cells expressing Caprola5-EGFP and incubated with CPY-CA (100 nM) in the presence or absence of thapsigargin (100 nM, 1 hour). Live and chemically fixed cells are shown. Ratio indicates CPY-CA/EGFP. (B) Flow cytometry analysis of HeLa cells expressing Caprola5-EGFP, Caprolaon-EGFP, or Caprolaoff-EGFP incubated with CPY-CA (100 nM, 1 hour) in the presence or absence of thapsigargin (100 nM) (N > 10,000 cells). (C) Flow cytometry analysis of HeLa cells expressing Caprola5-EGFP incubated with different fluorescent substrates (100 nM, 1 hour) in the presence or absence of thapsigargin (100 nM) (N > 10,000 cells). Error bars represent SEM. (D) Recording of three successive periods of Ca2+-activity in HeLa cells expressing Caprola5-EGFP. First period: ATP (100 μM) and JF525-CA (300 nM, 1 hour); second period: no treatment and CPY-CA (25 nM, 1 hour); third period: thapsigargin (Thap; 100 nM) and JF669-CA (300 nM, 1 hour). Between incubations, cells were allowed to recover for 2 hours. Fluorescence micrographs were acquired after the three recording periods. (E) Fluorescence micrographs of primary rat hippocampal neurons expressing Caprola4-EGFP labeled with CPY-CA (250 nM, 30 min) in the presence of synaptic blockers APV/NBQX (25 μM/10 μM) or glutamate/glycine (Glu/Gly; 10 μM/2.5 μM) or without treatment. Ratio indicates CPY-CA/EGFP. (F) Quantification of Caprola4 labeling from experiments described in (E) (N > 100 cells). The center line indicates the median, and error bars indicate 25 and 75% quantiles. (G) Ratiometric fluorescence micrographs (CPY-CA/EGFP) of primary rat hippocampal neurons expressing Caprola6-EGFP incubated with CPY-CA (1 or 0.1 μM, 30-min preincubation, 1-hour stimulation) upon defined electrical field stimulation. Action potentials (APs) were delivered in 10 short pulses (80 Hz) over the course of 1 hour interspaced with resting periods (approximately 7 min). (H) Quantification of Caprola6 labeling from experiments described in (G) (N > 100 cells). The center line indicates the median, and error bars indicate 25 and 75% quantiles. (I) Gating strategy of CPY-labeled (125 nM, 90 min) glioblastoma cells expressing Caprola6-EGFP for later RNA-seq analysis. (J) Transcriptional profiles of the three sorted groups from (I). DEGs identified by RNA-seq analysis are color coded according to Z-scores. DEGs were arranged in six groups according to their pairwise comparison pattern (e.g., up-regulated high versus low and high versus medium; inner circle). Glioblastoma prognosis markers are indicated in red, and DEGs identified in both Caprola6 and Caprolaon experiments are highlighted as black lines (outer circle). (K) Dot plots of the first principal coordinate analysis from Caprola6-EGFP– and Caprolaon-EGFP–expressing glioblastoma cells. Statistical significances in panels (F) and (H) were calculated with Welch’s t test, and p values are given for each comparison. In (A), (D), (E), and (G), color scale bars represent either fluorescence intensities or ratios, and scale bars are 20 μm. |