
- Title
-
Mycobacterium tuberculosis hijacks host macrophages-derived interleukin 16 to block phagolysosome maturation for enhancing intracellular growth
- Authors
- Su, H., Weng, S., Luo, L., Sun, Q., Lin, T., Ma, H., He, Y., Wu, J., Wang, H., Zhang, W., Xu, Y.
- Source
- Full text @ Emerg Microbes Infect
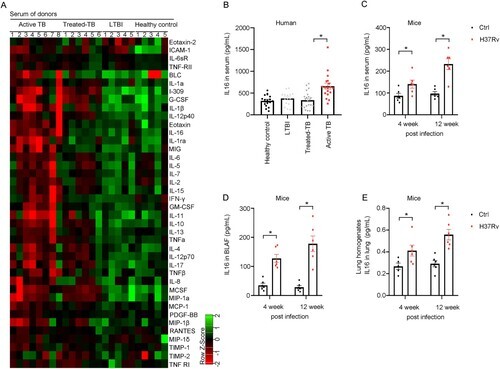
The level of IL16 is increased in Mtb-infected patients and mice. A The concentrations of 40 host markers in serum samples from patients with active TB, treated-TB, LTBI or healthy control using a multiplex cytokine platform (n = 5 to 8). B IL16 production by ELISA in serum samples from patients with active TB, treated-TB, LTBI or healthy control (n = 15 to 31). C to E Six to 8 weeks old female C57BL/6 mice were challenged intravenously with 1×10⁶ CFU of H37Rv. At 4 or 12 weeks after infection, the mice were sacrificed to determine IL-16 level in their serum samples (C), Bronchoalveolar lavage fluid (BALF) samples (D), and lung homogenates (E) (n = 6). Data represent means ± SEM. ∗p < 0.05, by 1-way ANOVA/Tukey’s multiple comparisons (B); Dots show the individual data, ∗p < 0.05, by Two-tailed Student’s t-test comparing H37Rv and control (C and D). |
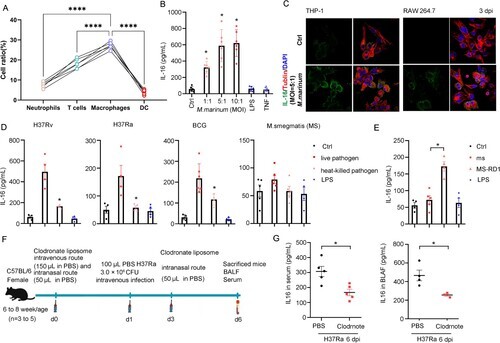
Macrophages are a major source of IL-16 secretion after Mycobacterium infection. A Analysis of lung cells from mice three weeks after Mtb infection revealed that IL-16-positive cell populations. B IL-16 level was increased as the rate of bacteria to monocytes-derived macrophages. Monocyte-derived macrophages were infected with M. marinum (MOI = 1:1, 5:1, 10:1) for 4 h. LPS and TNF were added at a concentration of 10 and 100 μg/mL, respectively. IL-16 in culture supernatants was quantified by ELISA (n = 6 to 8). C Thp-1 and RAW 264.7 were infected with M. marinum (MOI = 5:1) for 4 h. Three days post-infection (3 dpi), IL-16 was measured by immunofluorescence using confocal with a 63X oil objective. D and E Monocytes-derived macrophages were infected with H37Rv, H37Ra, BCG, M.smegmatis (MS) or M. smegmatis overexpressing RD1 (MS-RD1) at an MOI of 3:1 for 4 h. IL-16 production was measured by ELISA. LPS was added at a concentration of 100 μg/mL (n = 3 to 6). F Schematic diagram of lung macrophage depletion. Mice aged 6 to 8 weeks were administered clodronate liposomes or PBS control liposomes via the intravenous route (150 µL) and the intranasal route (50 µL) one day prior to infection. Then, C57BL/6 mice were intravenously challenged with 3.0×10⁶ CFU of H37Ra in 100 µL PBS. Three days post-infection, the mice were injected with clodronate liposomes or PBS control liposomes via the intranasal route (50 µL). G IL-16 level in BALF and serum 6 days post-infection, according to f (n = 3 to 5). data represent means ± SEM. ∗p < 0.05, by 1-way ANOVA/Tukey’s multiple comparisons (B, D, E); Dots show the individual data, **p< 0.001, ***p< 0.0001 by Two-tailed Student’s t-test comparing Clodrnote and PBS (G). |
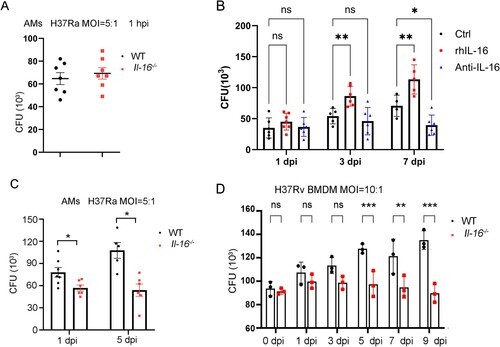
IL-16 secretion controls mycobacterium intracellular survival. A Alveolar macrophages (AMs) from wild-type (WT) or Il-16-/- mice were infected H37Ra at an MOI of 5:1 for 4 h. The mycobacterium uptake was measured by CFU counting at 1 hpi (n = 7 to 8). B Human monocytes-derived macrophages were pretreated with or without neutralized antibody anti-IL-16 (1 µg/mL), rhL-16 protein (10 ng/mL) for 18 h, infected with H37Rv (MOI = 3:1) for 4 h. Mycobacterium load was measured by CFU counting at 1, 3, and 7 dpi (n = 4 to 7). C H37Ra load was measured by CFU counting at 1 and 5 dpi, according to (A) (n = 6 to 8). D Bone Marrow-Derived Macrophages (BMDMs) from WT or Il-16-/- mice were infected H37Rv at an MOI of 3:1 for 4 h. The mycobacterium load was measured by CFU counting at 0 to 9 dpi (n = 3). *p<0.05 compared to media, Student's t-test. The graph shown is representative of 2 independent experiments. |
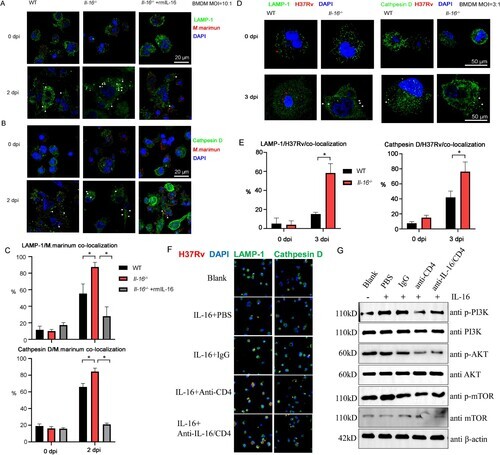
IL-16 deficiency promoted phagosome conversion in mycobacterium-infected macrophages. A to B WT and Il-16-/- BMDMs were infected with M.marinum (MOI = 10:1) in the presence or absence of rmL-16 protein (10 ng/mL). On day 2 post-infection, Rabbit Abs for M. marinum, mouse Abs for Lamp-1 (A), and mouse Abs for cathepsin D (B) were used. C Percent of co-localization of M. marinum and Lamp-1 or cathepsin D, according to A and B. D WT and Il-16-/- BMDMs were infected with H37Rv (MOI = 3:1) in the presence or absence of rmL-16 protein (10 ng/ml). On day 2 post-infection, Rabbit Abs for H37Rv, mouse Abs for Lamp-1, and mouse Abs for cathepsin D were used. E Percent of co-localization of H37Rv and Lamp-1 or cathepsin D, according to D. F Il-16-/- BMDMs were infected with H37Rv (MOI = 3:1) in the presence or absence of rmL-16 protein (10 ng/mL), rabbit anti CD4 or IL-16 and control IgG were added. On day 2 post-infection, Rabbit Abs for H37Rv, mouse Abs for Lamp-1, and mouse Abs for cathepsin D were used. G Western blotting analysis was used to examine the activation of PI3 K, AKT, mTOR, according to F. *p<0.05 compared to media, Student's t-test. The graph shown is representative of 2 independent experiments. |

IL-16 production repressed Rev-erbα expression in macrophages response to mycobacterium challenge. A and B Monocyte-derived macrophages were pretreated with or without neutralized antibody anti-IL-16 (1 µg/mL) or rhIL-16 protein (10 ng/mL) for 18 h. Then, the cells were infected with M. marinum (MOI = 5:1) for 4 h. Afterward, the cells were washed to remove unphagocytosed bacteria and further incubated with or without blocking antibodies (1 µg/mL) or rhL-16 (10 ng/mL) for additional time. Immunofluorescence by confocal imaging was used to detect the nuclear expression of Rev-erbα (A) and LXR4 (B) at 3 dpi. C Western blotting analysis was used to examine the expression of Rev-erbα, according to A. D WT or Il-16-/- BMDMs were infected with H37Rv (MOI = 3:1) for 4 h, washed to remove unphagocytosed bacteria and incubated for additional time with or without rhL-16 (10 ng/mL). Rev-erbα protein level was determined by Western blotting at 3 dpi. E Immunofluorescence was used to detect the nuclear expression of pro-IL-16 in monocyte-derived macrophages infected with M. marinum (MOI = 3:1) at 3 dpi by confocal analysis. F A bioinformatic search revealed a putative GAPBAα response motif flanked by a 12 bp sequence of TCTCTCCCGGTC in the Rev-erbα promoter. Ch-IP, re-ChIP and PCR assay were performed in macrophages infected with M. marinum (MOI = 5:1) at 3 dpi. Normal anti-IgG (2 μg), anti-pro-IL16 (2 μg), anti-GAPBα (2 μg) and anti-HDAC3 (2 μg) Abs were used for each immunoprecipitation. PCRs with non-immunoprecipitated genomic DNA (Input) were also performed as control. G Relative level of PCR- amplified Rev-erbα DNA by Image J, according to F. *p<0.05 compared to media, Student's t-test. The graph shown is representative of 2 independent experiments. |
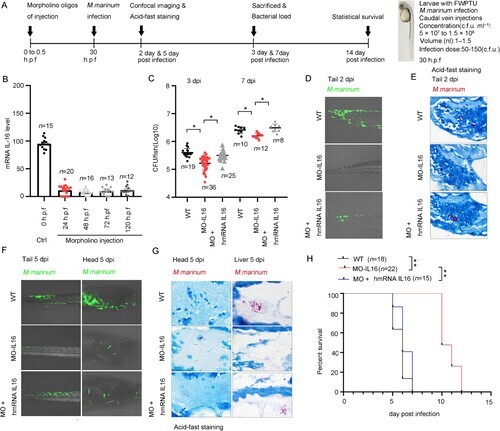
IL-16 impaired the clearance of M. marinum in zebrafish larvae. A Timeline of animal vaccination, infection and killing. Zebrafish larvae were injected with morpholino (MO)-IL-16 (10 ng), MO-control (10 ng), MO-IL-16 (10 ng) plus human IL-16 mRNA (100 pg) at 0-0.5 h.p.f. Zebrafish infection with M. marinum was performed via caudal vein injection with 1.0 to 1.5 nl per fish of a single-cell bacterial suspension in PBS at a dosage of 5.0×10⁷ CFU/mL at 30 h.p.f. B The relative level of IL-16 mRNA by qPCR in zebrafish larvae injected with morpholino oligos at indicated time (n = 12 to 20). C To assess the bacterial burdens, the homogenates of fish livers were plated onto 7H10 agar by serial dilution to determine CFU at 3 and 7 dpi (n = 8 to 36). D and F The overall reduction of infection level was determined by fluorescence microscopy. E and G Ziehl-Neelsen acid-fast staining was performed on 5 μm sections for gross pathology. H The survival of zebrafish during a 14-day infection. data represent means ± SEM. ∗p < 0.05, by 1-way ANOVA/Tukey’s multiple comparisons (B, C); A pool of 2 experiments is shown, including 15 to 22 zebrafish larvae per group as indicated, ∗∗p < 0.01 by log-rank test (H). |
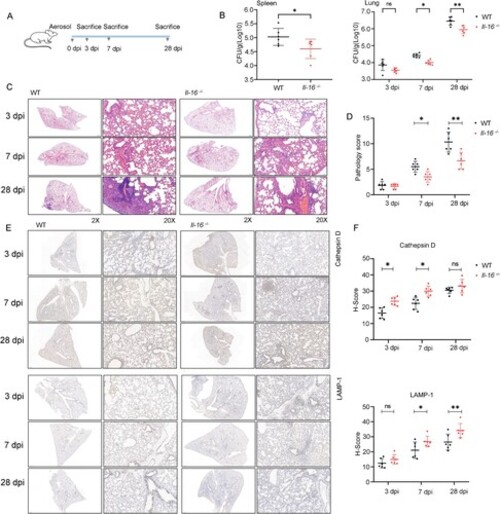
Interleukin 16 deficiency reduced the host susceptibility to H37Rv infection. A Schematic diagram of infection experiments. C57BL/6 or Il-16-/- mice were infected with ∼200 CFU of H37Rv using a Glas-Col inhalation exposure system (n = 6 to 8). B At 3-, 7- and 28-days post-infection, the mice were sacrificed, and bacterial counts in the lungs and spleens were determined on Middlebrook 7H10 agar. Mtb colonies were incubated at 37 °C and counted after 21 days (n = 6). C For histopathology analysis, half of each lung was fixed in a 4% neutral-buffered paraformaldehyde solution for 24 hours. Lung tissue was then embedded in paraffin. A series of sections with a thickness of 4-7 μm were then cut and stained with hematoxylin and eosin by standard methods. D Histopathology analysis was evaluated by pathologists in a blinded manner (n = 6). E LAMP-1 and Cathepsin D expression were analyzed by immunohistochemistry. F H-Score analysis was determined according to E. The values are the means ± SEM, 6 to 8 mice per group as indicated. *p<0.05 compared to media, Student's t-test. |
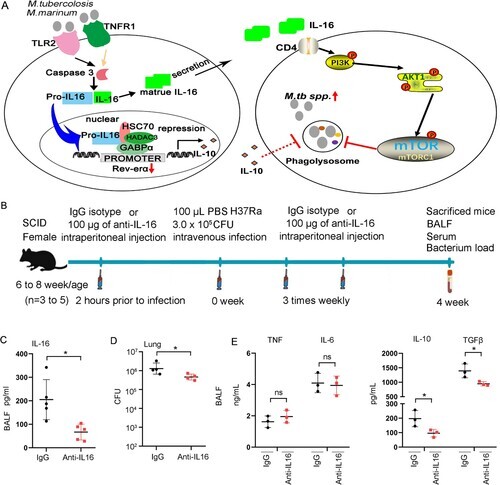
Neutralization of IL-16 contributes to host control of Mycobacterium infections. A Schematic diagram of GAPBAα/Pro-IL16/HDAC3 complex regulates Rev-erbα expression and IL-16 regulates the maturation of phagolysosomes through CD4. B Schematic diagram of neutralization of IL-16 in vivo. 6-8 weeks of age mice were intraperitoneally injected with 200 μg anti-IL-16 neutralizing mAb 2 h prior to infection. Mice were challenged with 3×10⁶ CFU of H37Ra in 100 μL PBS via the intravenous route, followed by intraperitoneal injection 3 times weekly with 200 μg anti-IL-16 neutralizing mAb. Control mice received 200 μg isotype-matched mouse IgG2a(κ). The mice were sacrificed 4 weeks post-infection (n = 3 to 5). C IL-16 level in BALF by ELISA (n = 3 to 5). D H37Ra load in lung (n = 3 to 5). E TNF, IL-6, IL-10 and TGF-β levels in BALF measured by ELISA (n = 3 to 5). *p<0.05 compared to media, Student's t-test. The graph shown is representative of 2 independent experiments. |