
|
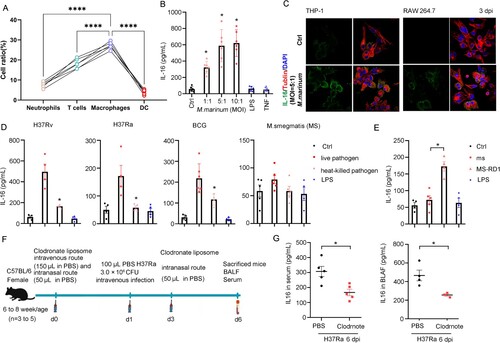
Fig. 2 Macrophages are a major source of IL-16 secretion after Mycobacterium infection. A Analysis of lung cells from mice three weeks after Mtb infection revealed that IL-16-positive cell populations. B IL-16 level was increased as the rate of bacteria to monocytes-derived macrophages. Monocyte-derived macrophages were infected with M. marinum (MOI = 1:1, 5:1, 10:1) for 4 h. LPS and TNF were added at a concentration of 10 and 100 μg/mL, respectively. IL-16 in culture supernatants was quantified by ELISA (n = 6 to 8). C Thp-1 and RAW 264.7 were infected with M. marinum (MOI = 5:1) for 4 h. Three days post-infection (3 dpi), IL-16 was measured by immunofluorescence using confocal with a 63X oil objective. D and E Monocytes-derived macrophages were infected with H37Rv, H37Ra, BCG, M.smegmatis (MS) or M. smegmatis overexpressing RD1 (MS-RD1) at an MOI of 3:1 for 4 h. IL-16 production was measured by ELISA. LPS was added at a concentration of 100 μg/mL (n = 3 to 6). F Schematic diagram of lung macrophage depletion. Mice aged 6 to 8 weeks were administered clodronate liposomes or PBS control liposomes via the intravenous route (150 µL) and the intranasal route (50 µL) one day prior to infection. Then, C57BL/6 mice were intravenously challenged with 3.0×10⁶ CFU of H37Ra in 100 µL PBS. Three days post-infection, the mice were injected with clodronate liposomes or PBS control liposomes via the intranasal route (50 µL). G IL-16 level in BALF and serum 6 days post-infection, according to f (n = 3 to 5). data represent means ± SEM. ∗p < 0.05, by 1-way ANOVA/Tukey’s multiple comparisons (B, D, E); Dots show the individual data, **p< 0.001, ***p< 0.0001 by Two-tailed Student’s t-test comparing Clodrnote and PBS (G).