FIGURE SUMMARY
Title

Differential inflammation responses determine the variable phenotypes of epilepsy induced by GABRG2 mutations

Authors
Sui, J., Zhan, L., Ji, S., Wu, W., Chen, Y., Yun, F., Liang, W., Wang, J., Cao, M., Shen, D., Zhang, Q.
Source
Full text @ CNS Neurosci Ther

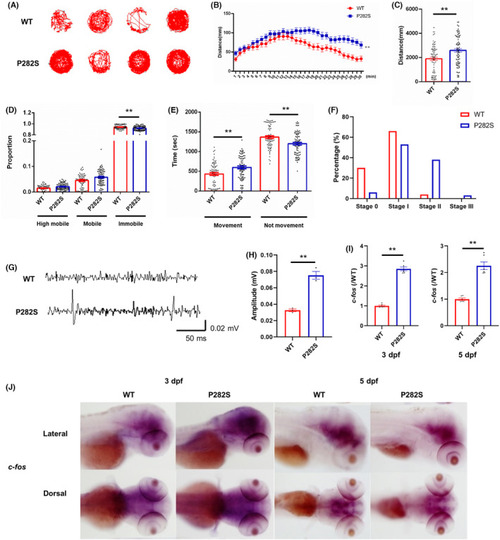
The establishment of Tg(hGABRG2P282S) zebrafish with hyperactivity and spontaneous seizures. (A) The representative locomotor activity of WT and P282S transgenic zebrafish larvae at 5 dpf recorded in the DanioVision Video‐Track system with EthoVision XT locomotion tracking software. (B) The distance of the transgenic zebrafish traveled every minute during the 30‐min recording time. (C) The quantification of the total distance traveled for each group. **p < 0.01 by Mann–Whitney U‐test (n = 73 in WT and n = 75 in P282S group). (D) The activity mobility of the transgenic zebrafish larvae was defined as immobile (proportion of activity time < 20%), mobile (proportion of activity time between 20% and 60%), and highly mobile (proportion of activity time > 60%). *p < 0.05, **p < 0.01 by one‐way ANOVA and subsequent Tukey's multiple comparisons (n = 73 in WT and n = 75 in P282S group). (E) The quantification of time spent in movement or not movement of the transgenic zebrafish larvae. **p < 0.01 by one‐way ANOVA and subsequent Tukey's multiple comparisons (n = 73 in WT and n = 75 in P282S group). (F) The percentage of WT and P282S zebrafish larvae reaching stage 0 to stage III at 5 dpf (n = 73 for WT larvae and n = 75 for P282S larvae). (G) The representative field recording was obtained from the WT and P282S transgenic zebrafish larvae. (H) The quantification of maximal amplitude of EEG. **p < 0.01 by Student's t‐test (n = 3 for each group). (I) Quantification of c‐fos mRNA expressions in WT and P282S zebrafish larvae at 3 dpf and 5 dpf by qRT‐PCR. The expression level in the WT group was set as “1” after normalization to the internal reference gene β‐actin. **p < 0.01 by Student's t‐test (n = 6 for each group and one sample = 10 pooled larvae). (J) WISH for c‐fos expression (dark purple) within the whole brain of WT and P282S larval zebrafish at 3 dpf and 5 dpf.

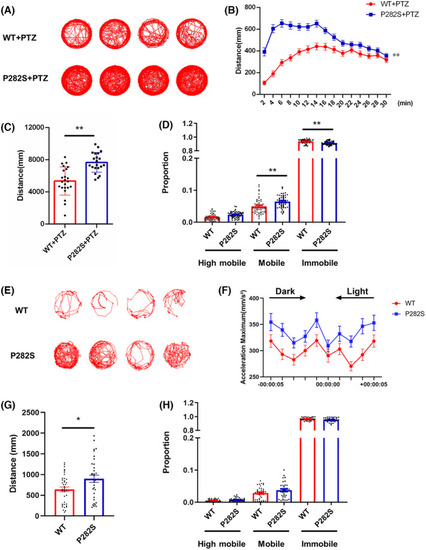
The locomotor activity changes of Tg(hGABRG2P282S) zebrafish with PTZ exposure and light flash stimulation. (A) The representative locomotor activity of WT and P282S transgenic zebrafish larvae at 5 dpf with 15 mM PTZ exposure. (B) The diagram showing the distance of the transgenic zebrafish traveled during the 30‐min recording time after PTZ exposure. (C) The quantification of the total distance traveled for each group with PTZ exposure. **p < 0.01 by Student's t‐test (n = 23 in WT and n = 21 in P282S group). (D) The mobility of the transgenic zebrafish larvae with PTZ exposure. **p < 0.01 by one‐way ANOVA and subsequent Tukey's multiple comparisons (n = 23 in WT and n = 21 in P282S group). (E) The representative locomotor activity of WT and P282S transgenic zebrafish larvae measured on 5 dpf during light flash stimulation (light on for 5 s and off for 5 s, a total of 100 cycles). (F) The diagram showing the acceleration maximum of the transgenic zebrafish during the light flash stimulation. (G) The quantification of the total distance traveled for each group with light flash stimulation. *p < 0.05 by Student's t‐test (n = 38 in WT and n = 33 in P282S group). (H) The mobility of the transgenic zebrafish larvae with light flash stimulation (n = 38 in WT and n = 33 in the P282S group).

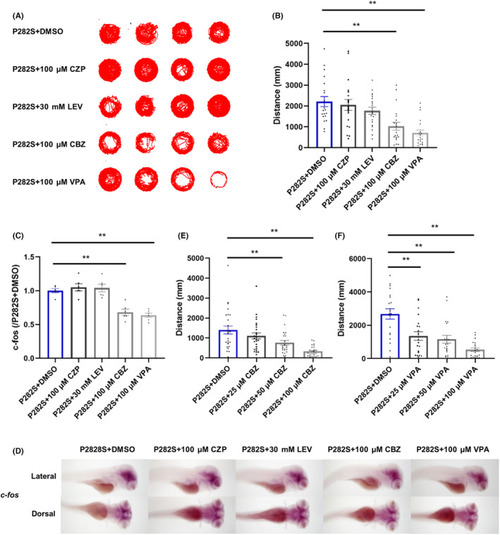
The effects of different traditional AEDs in Tg(hGABRG2P282S) zebrafish. (A) The representative locomotor activity of P282S transgenic zebrafish larvae treated with different traditional AEDs (100 μM CZP, 30 mM LEV, 100 μM CBZ, 100 μM VPA) for 30 min at 5 dpf. (B) The total distance of the P282S transgenic zebrafish larvae traveled with different traditional AEDs treatments. **p < 0.01 by Kruskal–Wallis test and subsequent Dunn's multiple comparisons test (n = 20 in each group). (C) Quantification of c‐fos mRNA expressions in the P282S zebrafish larvae treated with different traditional AEDs at 5 dpf by qRT‐PCR. The expression level in the P282S + DMSO group was set as “1” after normalization to the internal reference gene β‐actin. **p < 0.01 by one‐way ANOVA and subsequent Tukey's multiple comparisons (n = 6 for each group and one sample = 10 pooled larvae). (D) WISH for c‐fos expression (dark purple) within the whole brain of P282S larval zebrafish treated with different traditional AEDs (100 μM CZP, 30 mM LEV, 100 μM CBZ, 100 μM VPA) for 30 min at 5 dpf. (E) The quantification of the total distance traveled with different concentrations (25, 50, 100 μM) of CBZ. **p < 0.01 by one‐way ANOVA and subsequent Tukey's multiple comparisons (n = 26 in each group). (F) The quantification of the total distance traveled with different concentrations (25, 50, 100 μM) of VPA. **p < 0.01 by one‐way ANOVA and subsequent Tukey's multiple comparisons (n = 20 in each group).

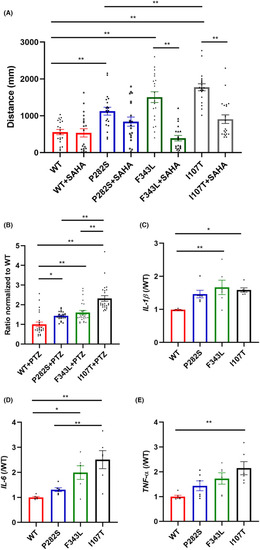
The comparison of behavioral activity, production of pro‐inflammatory factors, and response to SAHA treatment in different transgenic zebrafish. (A) The total distance of the P282S, F343L, and I107T transgenic zebrafish larvae traveled with 2.5 μM SAHA treatment. **p < 0.01 by one‐way ANOVA and subsequent Tukey's multiple comparisons (n = 20 in each group). (B) The response of the P282S, F343L, and I107T transgenic zebrafish larvae with 15 mM PTZ exposure. *p < 0.05, **p < 0.01 by one‐way ANOVA and subsequent Tukey's multiple comparisons (n = 20 in each group). The total distance of WT zebrafish traveled with PTZ exposure was set as “1”. (C) The production of IL‐1β in the P282S, F343L, and I107T transgenic zebrafish larvae at 5 dpf. *p < 0.05, **p < 0.01 by one‐way ANOVA and subsequent Tukey's multiple comparisons (n = 6 in each group and one sample = 10 pooled larvae). (D) The production of IL‐6 in the P282S, F343L, and I107T transgenic zebrafish larvae at 5 dpf. *p < 0.05, **p < 0.01 by one‐way ANOVA and subsequent Tukey's multiple comparisons (n = 6 in each group and one sample = 10 pooled larvae). (E) The production of TNF‐α in the P282S, F343L, and I107T transgenic zebrafish larvae at 5 dpf. **p < 0.01 by one‐way ANOVA and subsequent Tukey's multiple comparisons (n = 6 in each group and one sample = 10 pooled larvae).

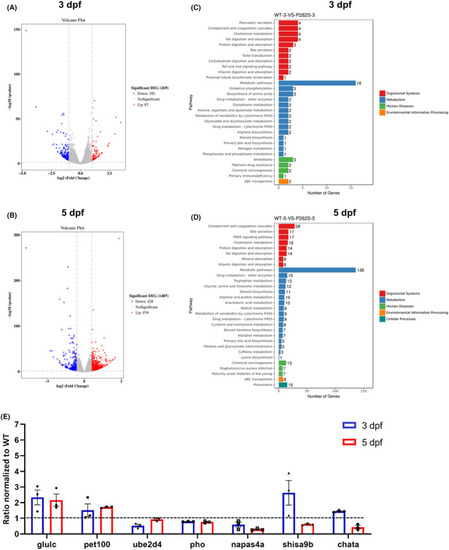
Brain transcriptional profile of Tg(hGABRG2P282S) zebrafish larvae. (A) Volcano plot of differentially expressed genes (DEGs) in the brains of P282S zebrafish and the WT controls at 3 dpf. (B) Volcano plot of DEGs in the brains of P282S zebrafish and the WT controls at 5 dpf. (C) KEGG pathway of the DEGs at 3 dpf. (D) KEGG pathway of the DEGs at 5 dpf. (E) qPCR validation of the relative expression of DEGs in the P282S zebrafish. The expression level in the WT group was set as “1” after normalization to the internal reference gene β‐actin at 3 dpf and 5 dpf, respectively. *p < 0.05, **p < 0.01 by one‐way ANOVA and subsequent Tukey's multiple comparisons (n = 3 for each group and one sample = 10 pooled larvae). The full list of DEGs at 3 dpf and 5 dpf is provided in Tables S2 and S3.

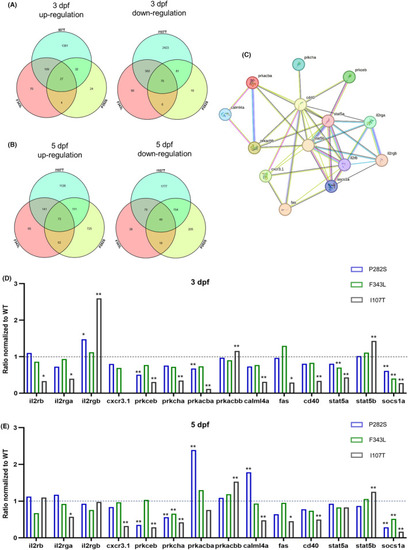
Differentially expressed genes in different mutant GABRG2 transgenic zebrafish. (A) Venn diagram of the up‐regulated genes and down‐regulated genes in the brains of P282S, F343L, and I107T transgenic zebrafish larvae at 3 dpf. (B) Venn‐diagram of the up‐regulated genes and down‐regulated genes in the brains of P282S, F343L, and I107T transgenic zebrafish larvae at 5 dpf. (C) PPI network of DEGs at both 3 dpf and 5 dpf. (D) The relative expressions of DEGs in the PPI network in the P282S, F343L, and I107T transgenic zebrafish larvae at 3 dpf. (E) The relative expressions of DEGs in the PPI network in the P282S, F343L, and I107T transgenic zebrafish larvae at 5 dpf.

Acknowledgments
This image is the copyrighted work of the attributed author or publisher, and ZFIN has permission only to display this image to its users. Additional permissions should be obtained from the applicable author or publisher of the image. Full text @ CNS Neurosci Ther