IMAGE

FIGURE 2

ID
ZDB-IMAGE-240216-21
Source
Figures for Sui et al., 2024
Image
Figure Caption

FIGURE 2

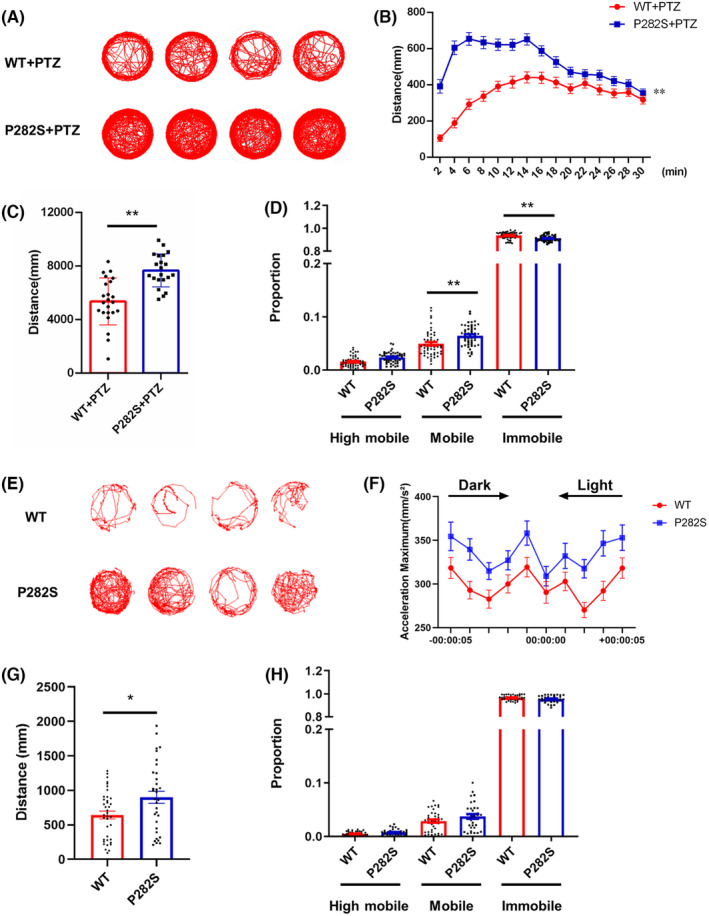
The locomotor activity changes of Tg(hGABRG2P282S) zebrafish with PTZ exposure and light flash stimulation. (A) The representative locomotor activity of WT and P282S transgenic zebrafish larvae at 5 dpf with 15 mM PTZ exposure. (B) The diagram showing the distance of the transgenic zebrafish traveled during the 30‐min recording time after PTZ exposure. (C) The quantification of the total distance traveled for each group with PTZ exposure. **p < 0.01 by Student's t‐test (n = 23 in WT and n = 21 in P282S group). (D) The mobility of the transgenic zebrafish larvae with PTZ exposure. **p < 0.01 by one‐way ANOVA and subsequent Tukey's multiple comparisons (n = 23 in WT and n = 21 in P282S group). (E) The representative locomotor activity of WT and P282S transgenic zebrafish larvae measured on 5 dpf during light flash stimulation (light on for 5 s and off for 5 s, a total of 100 cycles). (F) The diagram showing the acceleration maximum of the transgenic zebrafish during the light flash stimulation. (G) The quantification of the total distance traveled for each group with light flash stimulation. *p < 0.05 by Student's t‐test (n = 38 in WT and n = 33 in P282S group). (H) The mobility of the transgenic zebrafish larvae with light flash stimulation (n = 38 in WT and n = 33 in the P282S group).

Acknowledgments
This image is the copyrighted work of the attributed author or publisher, and ZFIN has permission only to display this image to its users. Additional permissions should be obtained from the applicable author or publisher of the image. Full text @ CNS Neurosci Ther