IMAGE

FIGURE 6

ID
ZDB-IMAGE-240216-25
Source
Figures for Sui et al., 2024
Image
Figure Caption

FIGURE 6

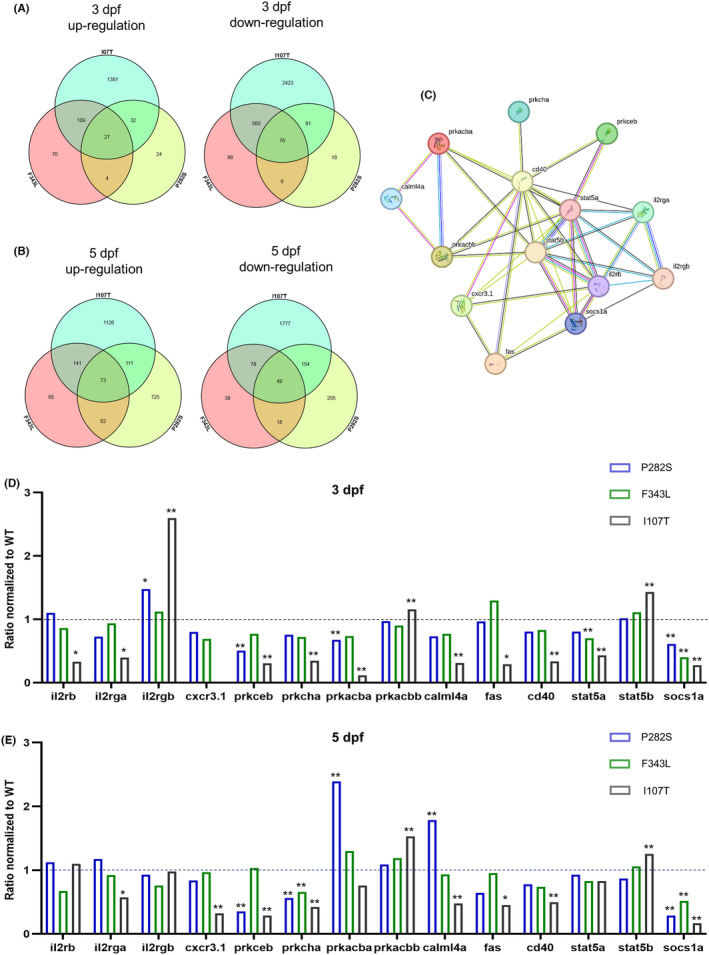
Differentially expressed genes in different mutant GABRG2 transgenic zebrafish. (A) Venn diagram of the up‐regulated genes and down‐regulated genes in the brains of P282S, F343L, and I107T transgenic zebrafish larvae at 3 dpf. (B) Venn‐diagram of the up‐regulated genes and down‐regulated genes in the brains of P282S, F343L, and I107T transgenic zebrafish larvae at 5 dpf. (C) PPI network of DEGs at both 3 dpf and 5 dpf. (D) The relative expressions of DEGs in the PPI network in the P282S, F343L, and I107T transgenic zebrafish larvae at 3 dpf. (E) The relative expressions of DEGs in the PPI network in the P282S, F343L, and I107T transgenic zebrafish larvae at 5 dpf.

Acknowledgments
This image is the copyrighted work of the attributed author or publisher, and ZFIN has permission only to display this image to its users. Additional permissions should be obtained from the applicable author or publisher of the image. Full text @ CNS Neurosci Ther