IMAGE

FIGURE 5

ID
ZDB-IMAGE-240216-24
Source
Figures for Sui et al., 2024
Image
Figure Caption

FIGURE 5

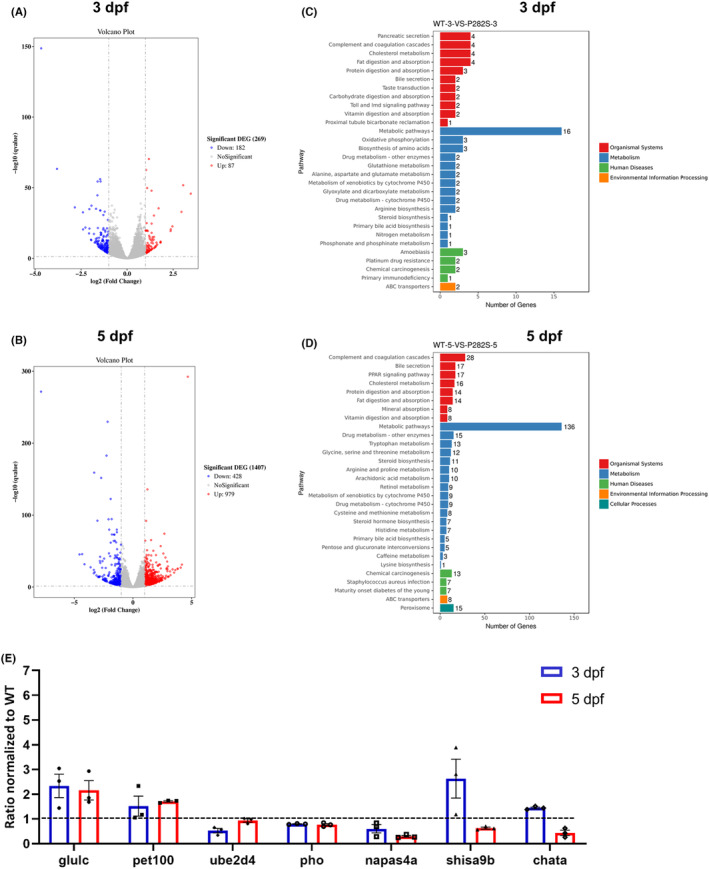
Brain transcriptional profile of Tg(hGABRG2P282S) zebrafish larvae. (A) Volcano plot of differentially expressed genes (DEGs) in the brains of P282S zebrafish and the WT controls at 3 dpf. (B) Volcano plot of DEGs in the brains of P282S zebrafish and the WT controls at 5 dpf. (C) KEGG pathway of the DEGs at 3 dpf. (D) KEGG pathway of the DEGs at 5 dpf. (E) qPCR validation of the relative expression of DEGs in the P282S zebrafish. The expression level in the WT group was set as “1” after normalization to the internal reference gene β‐actin at 3 dpf and 5 dpf, respectively. *p < 0.05, **p < 0.01 by one‐way ANOVA and subsequent Tukey's multiple comparisons (n = 3 for each group and one sample = 10 pooled larvae). The full list of DEGs at 3 dpf and 5 dpf is provided in Tables S2 and S3.

Acknowledgments
This image is the copyrighted work of the attributed author or publisher, and ZFIN has permission only to display this image to its users. Additional permissions should be obtained from the applicable author or publisher of the image. Full text @ CNS Neurosci Ther