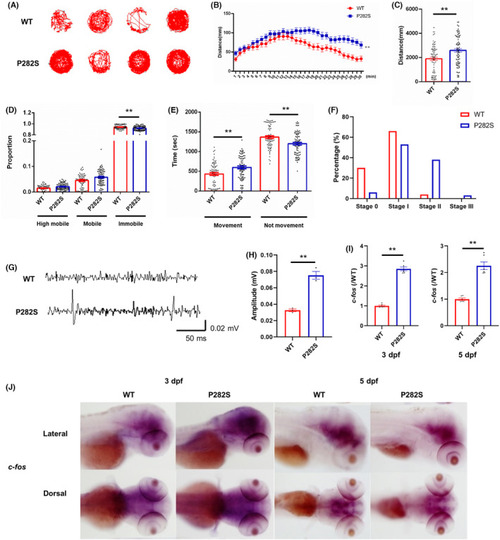
The establishment of Tg(hGABRG2P282S) zebrafish with hyperactivity and spontaneous seizures. (A) The representative locomotor activity of WT and P282S transgenic zebrafish larvae at 5 dpf recorded in the DanioVision Video‐Track system with EthoVision XT locomotion tracking software. (B) The distance of the transgenic zebrafish traveled every minute during the 30‐min recording time. (C) The quantification of the total distance traveled for each group. **p < 0.01 by Mann–Whitney U‐test (n = 73 in WT and n = 75 in P282S group). (D) The activity mobility of the transgenic zebrafish larvae was defined as immobile (proportion of activity time < 20%), mobile (proportion of activity time between 20% and 60%), and highly mobile (proportion of activity time > 60%). *p < 0.05, **p < 0.01 by one‐way ANOVA and subsequent Tukey's multiple comparisons (n = 73 in WT and n = 75 in P282S group). (E) The quantification of time spent in movement or not movement of the transgenic zebrafish larvae. **p < 0.01 by one‐way ANOVA and subsequent Tukey's multiple comparisons (n = 73 in WT and n = 75 in P282S group). (F) The percentage of WT and P282S zebrafish larvae reaching stage 0 to stage III at 5 dpf (n = 73 for WT larvae and n = 75 for P282S larvae). (G) The representative field recording was obtained from the WT and P282S transgenic zebrafish larvae. (H) The quantification of maximal amplitude of EEG. **p < 0.01 by Student's t‐test (n = 3 for each group). (I) Quantification of c‐fos mRNA expressions in WT and P282S zebrafish larvae at 3 dpf and 5 dpf by qRT‐PCR. The expression level in the WT group was set as “1” after normalization to the internal reference gene β‐actin. **p < 0.01 by Student's t‐test (n = 6 for each group and one sample = 10 pooled larvae). (J) WISH for c‐fos expression (dark purple) within the whole brain of WT and P282S larval zebrafish at 3 dpf and 5 dpf.
|
