FIGURE

FIGURE 4

ID
ZDB-FIG-240216-23
Publication
Sui et al., 2024 - Differential inflammation responses determine the variable phenotypes of epilepsy induced by GABRG2 mutations
Other Figures
All Figure Page
Back to All Figure Page
FIGURE 4

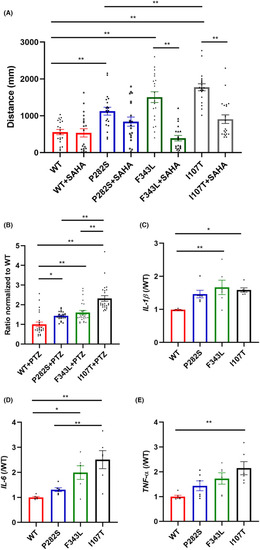
The comparison of behavioral activity, production of pro‐inflammatory factors, and response to SAHA treatment in different transgenic zebrafish. (A) The total distance of the P282S, F343L, and I107T transgenic zebrafish larvae traveled with 2.5 μM SAHA treatment. **p < 0.01 by one‐way ANOVA and subsequent Tukey's multiple comparisons (n = 20 in each group). (B) The response of the P282S, F343L, and I107T transgenic zebrafish larvae with 15 mM PTZ exposure. *p < 0.05, **p < 0.01 by one‐way ANOVA and subsequent Tukey's multiple comparisons (n = 20 in each group). The total distance of WT zebrafish traveled with PTZ exposure was set as “1”. (C) The production of IL‐1β in the P282S, F343L, and I107T transgenic zebrafish larvae at 5 dpf. *p < 0.05, **p < 0.01 by one‐way ANOVA and subsequent Tukey's multiple comparisons (n = 6 in each group and one sample = 10 pooled larvae). (D) The production of IL‐6 in the P282S, F343L, and I107T transgenic zebrafish larvae at 5 dpf. *p < 0.05, **p < 0.01 by one‐way ANOVA and subsequent Tukey's multiple comparisons (n = 6 in each group and one sample = 10 pooled larvae). (E) The production of TNF‐α in the P282S, F343L, and I107T transgenic zebrafish larvae at 5 dpf. **p < 0.01 by one‐way ANOVA and subsequent Tukey's multiple comparisons (n = 6 in each group and one sample = 10 pooled larvae).

Expression Data

Expression Detail
Antibody Labeling
Phenotype Data

Phenotype Detail
Acknowledgments
This image is the copyrighted work of the attributed author or publisher, and ZFIN has permission only to display this image to its users. Additional permissions should be obtained from the applicable author or publisher of the image. Full text @ CNS Neurosci Ther