IMAGE

FIGURE 3

ID
ZDB-IMAGE-240216-22
Source
Figures for Sui et al., 2024
Image
Figure Caption

FIGURE 3

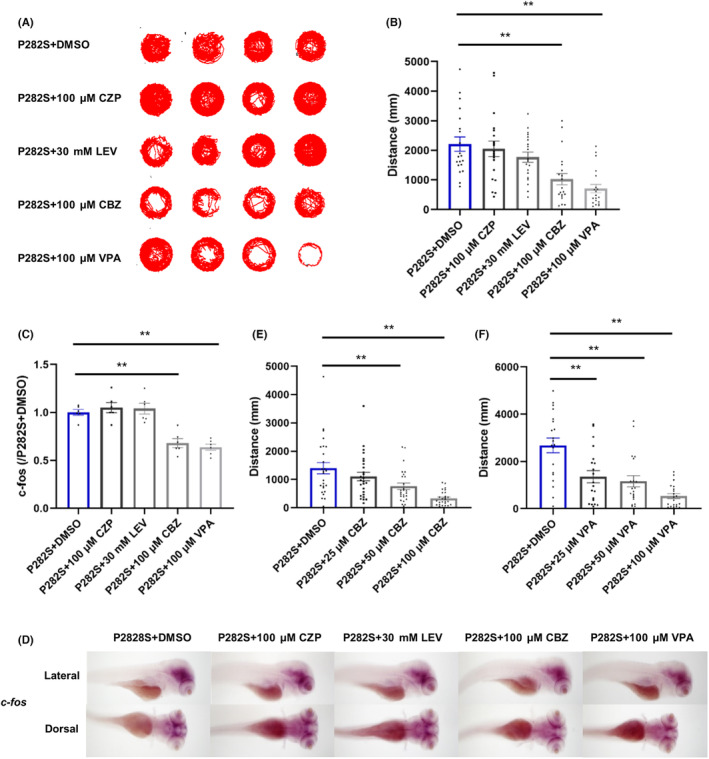
The effects of different traditional AEDs in Tg(hGABRG2P282S) zebrafish. (A) The representative locomotor activity of P282S transgenic zebrafish larvae treated with different traditional AEDs (100 μM CZP, 30 mM LEV, 100 μM CBZ, 100 μM VPA) for 30 min at 5 dpf. (B) The total distance of the P282S transgenic zebrafish larvae traveled with different traditional AEDs treatments. **p < 0.01 by Kruskal–Wallis test and subsequent Dunn's multiple comparisons test (n = 20 in each group). (C) Quantification of c‐fos mRNA expressions in the P282S zebrafish larvae treated with different traditional AEDs at 5 dpf by qRT‐PCR. The expression level in the P282S + DMSO group was set as “1” after normalization to the internal reference gene β‐actin. **p < 0.01 by one‐way ANOVA and subsequent Tukey's multiple comparisons (n = 6 for each group and one sample = 10 pooled larvae). (D) WISH for c‐fos expression (dark purple) within the whole brain of P282S larval zebrafish treated with different traditional AEDs (100 μM CZP, 30 mM LEV, 100 μM CBZ, 100 μM VPA) for 30 min at 5 dpf. (E) The quantification of the total distance traveled with different concentrations (25, 50, 100 μM) of CBZ. **p < 0.01 by one‐way ANOVA and subsequent Tukey's multiple comparisons (n = 26 in each group). (F) The quantification of the total distance traveled with different concentrations (25, 50, 100 μM) of VPA. **p < 0.01 by one‐way ANOVA and subsequent Tukey's multiple comparisons (n = 20 in each group).

Acknowledgments
This image is the copyrighted work of the attributed author or publisher, and ZFIN has permission only to display this image to its users. Additional permissions should be obtained from the applicable author or publisher of the image. Full text @ CNS Neurosci Ther