FIGURE SUMMARY
Title

Calcium imaging of adult olfactory epithelium reveals amines as important odor class in fish

Authors
Dieris, M., Kowatschew, D., Hassenklöver, T., Manzini, I., Korsching, S.I.
Source
Full text @ Cell Tissue Res.

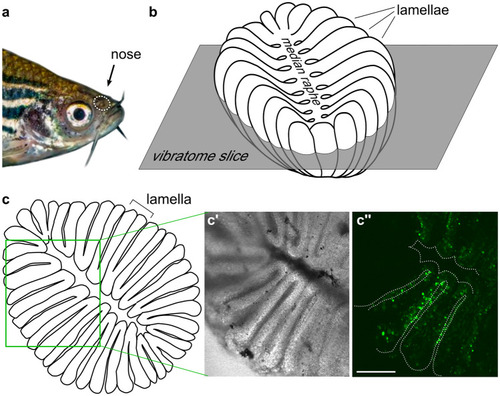
Slice preparation of adult zebrafish olfactory epithelium for calcium imaging. The position of the nose is shown by the white dotted oval (a). Schematic representation of the olfactory epithelium (b), lumen is up, individual lamellae and the median raphe are visible. The horizontal orientation and approximate height of the vibratome section plane is shown. En face view of the vibratome section (c), cross-sectioned lamellae and the median raphe are visible. In the schematic representation (c), the green rectangle corresponds approximately to the region shown in (c', c''). A representative vibratome section used for calcium imaging (bright field (c') and fluorescent signals (c'') after loading with Fluo4-AM, respectively)

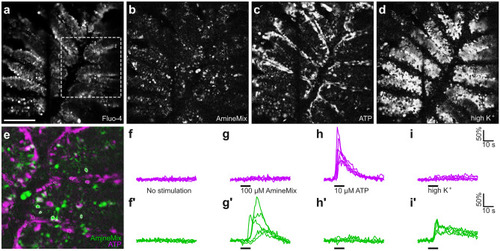
Odor-induced activity for two stimuli classes, amines, and nucleotides. Fluo4-loaded olfactory epithelium slice (a), fluorescence is averaged over complete experiment, dashed box is shown magnified in (e). Correlation maps for similarity in fluorescence changes upon stimulation (bd). The degree of correlation of fluorescence changes after stimulation in neighboring pixels is shown in grey scale (bd). The slice is stimulated with 100 μM amine mixture in ACSF (b), 10 μM ATP in ACSF (c), and high K+(d). E Overlay of correlation maps for amine mixture (green) and ATP (magenta) responses. ROIs for quantitative evaluation are shown with solid (amine mixture) or dashed (ATP) enclosure (e). Note that amines and ATP activate different subsets of cells in the olfactory epithelium. Traces for cells identified as ATP-responsive (f, g, h, i, magenta) and as amine-responsive (f', g', h', i', green). Note that only amine-responsive cells respond to high K+

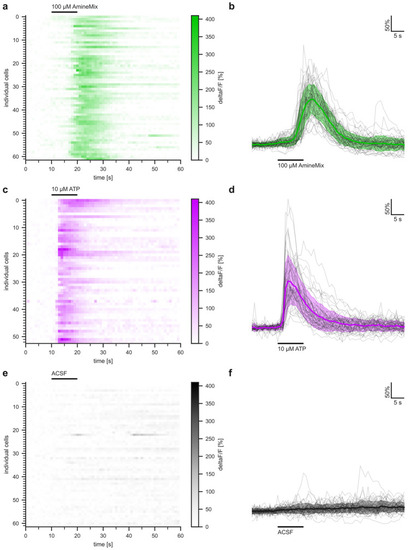
Calcium response kinetics for amines differ from those for ATP. Panels (a, c, e) heat maps represent color-coded changes in fluorescence over time in response to an odor pulse (black bar) for individual cells, number of cells as indicated. The respective color scales are shown to the right of the heat maps. Green colors, amine stimulus; magenta colors, ATP stimulus, concentrations as indicated. Panels (b, d, f) single cell (black curves) and averaged calcium response profiles (mean+/− SD, thick colored line and lightly colored area, respectively). 62 amine-responsive ROIs (a, b), 53 ATP-responsive ROIs (c, d), and 62 ACSF responses for the amine-responsive ROIs (e, f, negative control), all results are from the same slice

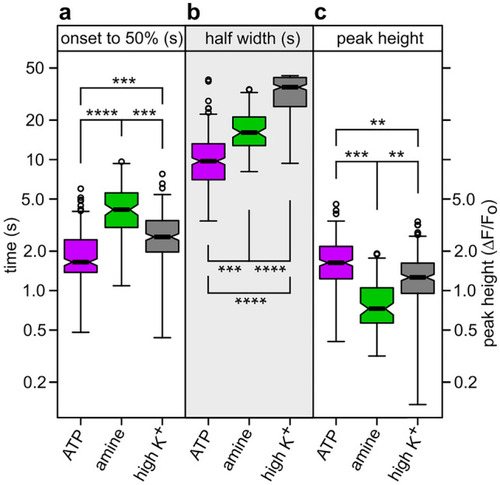
Statistical analysis shows amine responses significantly different from ATP responses. Calcium responses were measured for cells responding to the amine-mix (103 cells) and to ATP (269 cells). No overlap in cell populations was seen. Additionally, responses to high K+ (225 cells) were measured at the end of an experiment. Three kinetic parameters were quantified: Onset time, measured from onset of response to 50% of maximal peak height (a, time to 50%), peak width at half-maximal height (b, half width), and maximal peak height (c, peak height), expressed as ∆F/F0. Distributions are shown as box plots, notches represent 95% confidence interval, outliers are shown as circles. Significance was estimated with two-tailed t-test, **p < 10–10, ***p < 10–15; ****p < 10–30. Note that all three response characteristics are highly significantly different for amine vs. ATP responses

Spatial distribution of amine-responding cells equals that of OMP-positive cells. Representative half-lamella segments of olfactory epithelium (a, a', a''), basal is down, apical (toward lumen) is up. PCNA, IHC staining (a); OMP (a') and TRPC2 (a''), transgene labeling. PCNA and TRPC2 signal are depicted in false color. Scale bars 10 μm. Laminar height within the lamella (b) is determined as the distance from the basal lamina to cell soma center (hi) divided by the total laminar height h0 at that position and is depicted as empirical cumulative distribution function for five cell populations: ATP, ATP-responsive cells in calcium imaging; PCNA, PCNA-immunoreactive cells; Amine, amine-responsive cells in calcium imaging; OMP, OMP-transgene; TRPC2, TRPC2 transgene. Note that occasionally PCNA+ cells with neuronal morphology are observed (a, asterisk), these are most likely immature neurons that still retain some PCNA protein. The inset in (b) shows the schematical cell shapes for progenitor cells (PCNA+), ciliated (OMP+), and microvillous (TRPC2+) neurons. Mean laminar height (c) for the five cell populations depicted in (b), color code as for (b). Error bars depict SEM. Amine responses are distinctly and significantly different from both PCNA and TRPC2-expressing cells, but appear identical to OMP-expressing cells. **p < 10–7; ***p < 10–15

Acknowledgments
This image is the copyrighted work of the attributed author or publisher, and ZFIN has permission only to display this image to its users. Additional permissions should be obtained from the applicable author or publisher of the image. Full text @ Cell Tissue Res.