
Fig. 3
- ID
- ZDB-IMAGE-240408-72
- Publication
- Dieris et al., 2024 - Calcium imaging of adult olfactory epithelium reveals amines as important odor class in fish
- All Figures
- Figures for Dieris et al., 2024
|
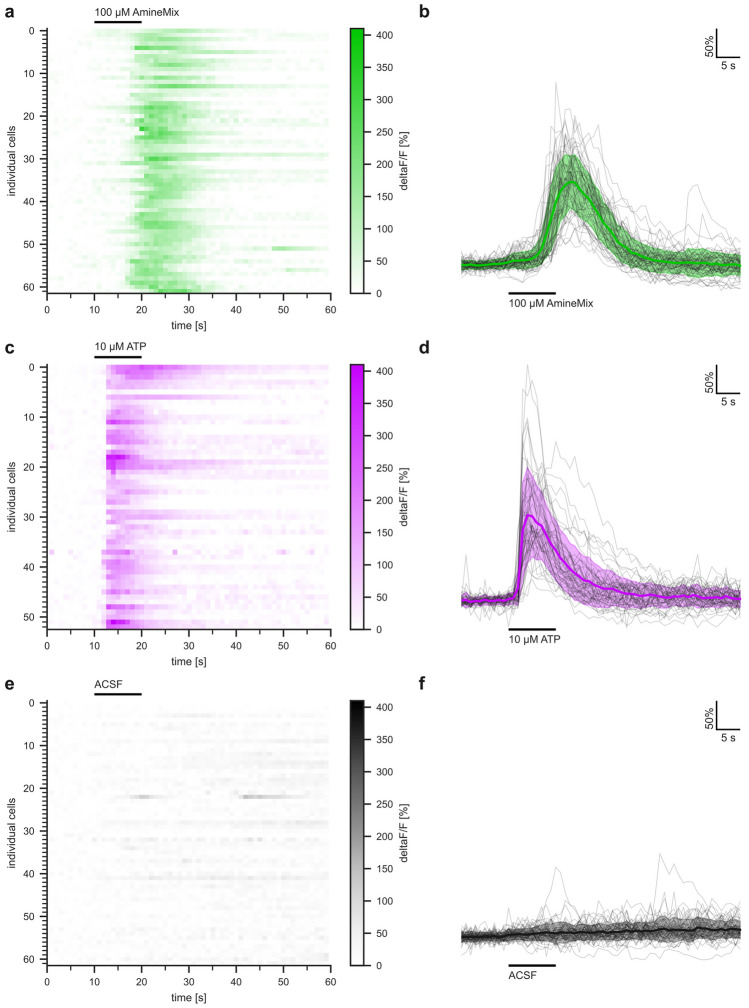
Fig. 3
Calcium response kinetics for amines differ from those for ATP. Panels (