IMAGE

Fig. 2

ID
ZDB-IMAGE-240408-71
Source
Figures for Dieris et al., 2024
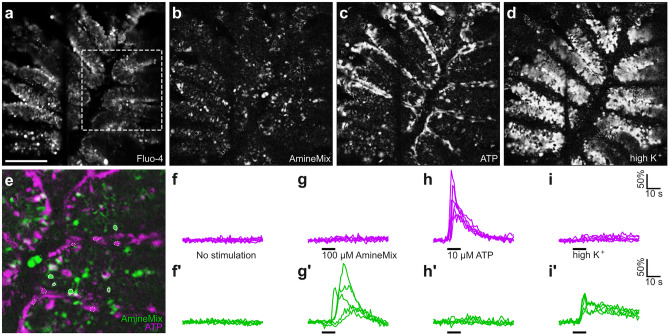
Image
Figure Caption

Fig. 2

Odor-induced activity for two stimuli classes, amines, and nucleotides. Fluo4-loaded olfactory epithelium slice (a), fluorescence is averaged over complete experiment, dashed box is shown magnified in (e). Correlation maps for similarity in fluorescence changes upon stimulation (bd). The degree of correlation of fluorescence changes after stimulation in neighboring pixels is shown in grey scale (bd). The slice is stimulated with 100 μM amine mixture in ACSF (b), 10 μM ATP in ACSF (c), and high K+(d). E Overlay of correlation maps for amine mixture (green) and ATP (magenta) responses. ROIs for quantitative evaluation are shown with solid (amine mixture) or dashed (ATP) enclosure (e). Note that amines and ATP activate different subsets of cells in the olfactory epithelium. Traces for cells identified as ATP-responsive (f, g, h, i, magenta) and as amine-responsive (f', g', h', i', green). Note that only amine-responsive cells respond to high K+

Acknowledgments
This image is the copyrighted work of the attributed author or publisher, and ZFIN has permission only to display this image to its users. Additional permissions should be obtained from the applicable author or publisher of the image. Full text @ Cell Tissue Res.