
- Title
-
Lipid regulation of protocatechualdehyde and hydroxysafflor yellow A via AMPK/SREBP2/PCSK9/LDLR signaling pathway in hyperlipidemic zebrafish
- Authors
- Lin, B., Wan, H., Yang, J., Yu, L., Zhou, H., Wan, H.
- Source
- Full text @ Heliyon

Toxic phenotype of zebrafish larvae. (A)No obvious abnormality, (B)uninflated swim bladder, (C)pericardial edema, (D)spinal curvature and (E)death. Magnification: (A–C)20 × , (D)15 × and (E)7 × . |
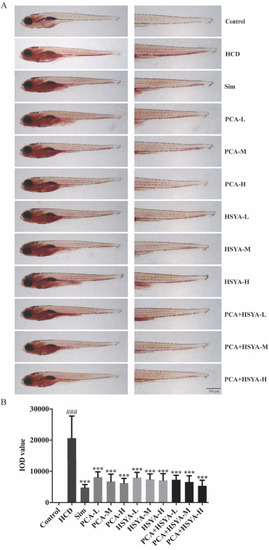
Sim, PCA, HSYA and PCA + HSYA all decreased lipid accumulation in the caudal vein. (A) Oil red O staining of zebrafish larvae. (B)IOD values. The Control group; HCD group; PCA-L, HCD + PCA 25 μg/mL; PCA-M, HCD + PCA 50 μg/mL; PCA-H, HCD + PCA 100 μg/mL; HSYA-L, HCD + HSYA 25 μg/mL; HSYA-M, HCD + HSYA 50 μg/mL; HSYA-H, HCD + HSYA 100 μg/mL; PCA + HSYA-L, HCD + PCA 25 μg/mL + HSYA 25 μg/mL; PCA + HSYA-M, HCD + PCA 50 μg/mL + HSYA 50 μg/mL; PCA + HSYA-H, HCD + PCA 100 μg/mL + HSYA 100 μg/mL ###P < 0.001, in comparison with the Control group. ***P < 0.001, in comparison with the HCD group, and the error bars represent SD. Magnification: (A)20 × and 45 × . |
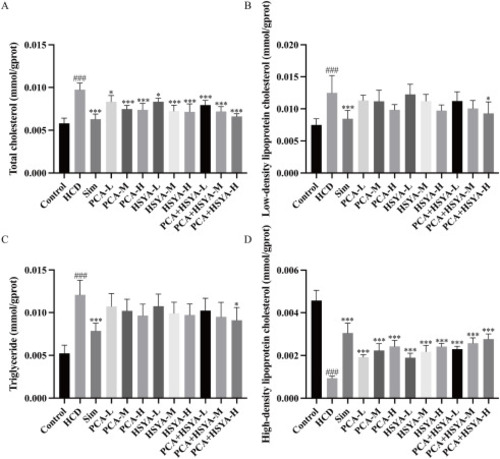
Effects of PCA, HSYA and PCA + HSYA administration on HCD-induced hyperlipidemia in zebrafish larvae. The Control group; HCD group; PCA-L, HCD + PCA 25 μg/mL; PCA-M, HCD + PCA 50 μg/mL; PCA-H, HCD + PCA 100 μg/mL; HSYA-L, HCD + HSYA 25 μg/mL; HSYA-M, HCD + HSYA 50 μg/mL; HSYA-H, HCD + HSYA 100 μg/mL; PCA + HSYA-L, HCD + PCA 25 μg/mL + HSYA 25 μg/mL; PCA + HSYA-M, HCD + PCA 50 μg/mL + HSYA 50 μg/mL; PCA + HSYA-H, HCD + PCA 100 μg/mL + HSYA 100 μg/mL. Histogram of (A)TC, (B)LDL-C, (C)TG and (D)HDL-C in zebrafish larvae. ###P < 0.001, in comparison with the Control group. *P < 0.05, ***P < 0.001, compared with the HCD group, and the error bars represent SD. |
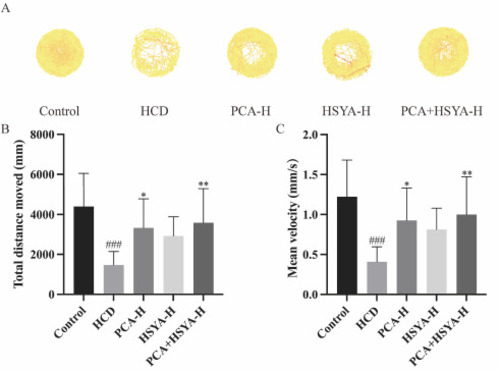
Behavior evaluation of zebrafish larvae in each group. The Control group; HCD group; PCA-H, HCD + PCA 100 μg/mL; HSYA-H, HCD + HSYA 100 μg/mL; PCA + HSYA-H, HCD + PCA 100 μg/mL + HSYA 100 μg/mL (A)Behavioral trajectories of each group of zebrafish larvae. (B)Graphical representation of total distance moved (mm) of treated larvae in the Control, HCD, PCA-H, HSYA-H and PCA + HSYA-H groups. (C)Graphical representation of the mean velocity (mm/s) of treated larvae in the Control, HCD, PCA-H, HSYA-H and PCA + HSYA-H groups. ###P < 0.001, in comparison with the Control group. *P < 0.05, **P < 0.01, in comparison with the HCD group, and the error bars represent SD. |
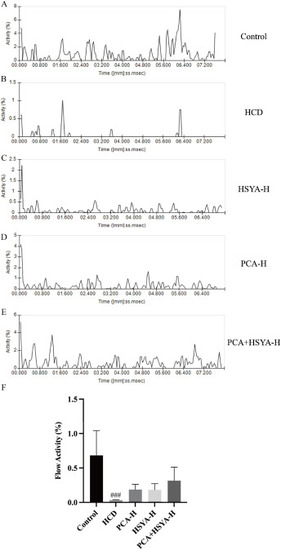
Hemodynamic evaluation of zebrafish larvae. The Control group; HCD group; PCA-H, HCD + PCA 100 μg/mL; HSYA-H, HCD + HSYA 100 μg/mL; PCA + HSYA-H, HCD + PCA 100 μg/mL + HSYA 100 μg/mL. The flow activity of zebrafish larvae in the (A)Control, (B)HCD, (C)PCA-H, (D)HSYA-H and (E)PCA + HSYA-H groups. (F)Histogram representation of flow activity. ###P < 0.001, in comparison with the Control group, and the error bars represent SD. |
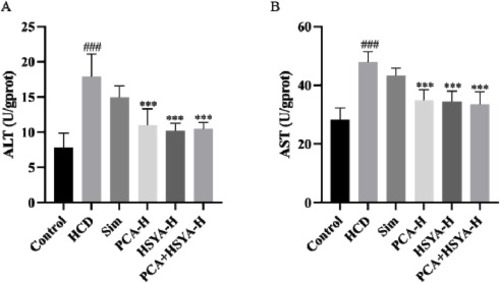
PCA, HSYA and PCA + HSYA can reduce AST and ALT levels. The Control group; HCD group; PCA-H, HCD + PCA 100 μg/mL; HSYA-H, HCD + HSYA 100 μg/mL; PCA + HSYA-H, HCD + PCA 100 μg/mL + HSYA 100 μg/mL (A-B)Zebrafish larvae fed HCD were given PCA, HSYA and PCA + HSYA, and AST and ALT levels were measured. ###P < 0.001 in comparison with the Control group; ***P < 0.001, in comparison with the HCD group, and the error bars represent SD. |

Pathological observation of the liver in each group of zebrafish larvae. The Control group; HCD group; PCA-H, HCD + PCA 100 μg/mL; HSYA-H, HCD + HSYA 100 μg/mL; PCA + HSYA-H, HCD + PCA 100 μg/mL + HSYA 100 μg/mL (A-B)Control, (C)HCD, (D)Sim, (E)PCA-H, (F)HSYA-H and (G)PCA + HSYA-H groups. Magnification: (A)100 × and (B–G)400 × . |
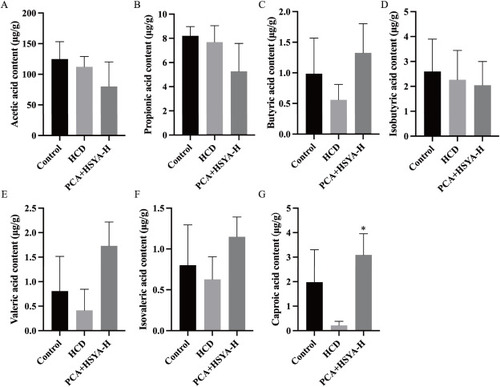
Contents of SCFAs in zebrafish larvae. The Control group; HCD group; PCA-H, HCD + PCA 100 μg/mL; HSYA-H, HCD + HSYA 100 μg/mL; PCA + HSYA-H, HCD + PCA 100 μg/mL + HSYA 100 μg/mL (A)Acetic acid, (B)propionic acid, (C)butyric acid, (D)isobutyric acid, (E)valeric acid, (F)isovaleric acid and (G)caproic acid. *P < 0.05, in comparison with the HCD group, and the error bars represent SD. |
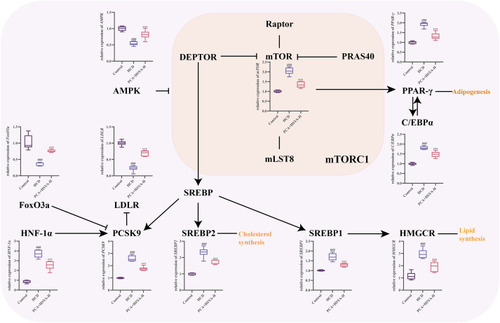
Relative mRNA expression in zebrafish groups. The Control group; HCD group; PCA-H, HCD + PCA 100 μg/mL; HSYA-H, HCD + HSYA 100 μg/mL; PCA + HSYA-H, HCD + PCA 100 μg/mL + HSYA 100 μg/mL. Relative mRNA expression of SREBP2, SREBP1, AMPK, PCSK9, LDLR, HMGCR, PPAR-γ, C/EBPα, mTOR, HNF-1α and FoxO3a. ###P < 0.001, in comparison to the Control group. ***P < 0.001, in comparison to the HCD group. |