
Image
|
Figure Caption
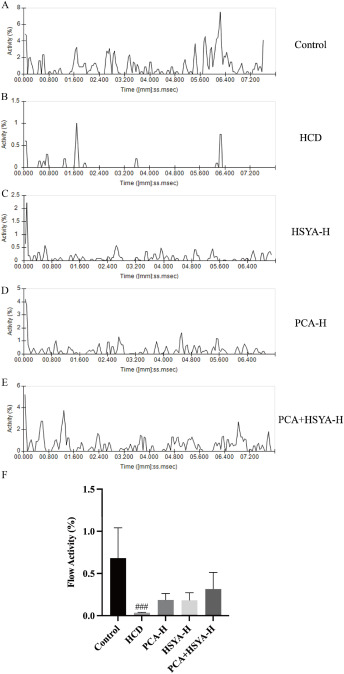
Fig. 5 Hemodynamic evaluation of zebrafish larvae. The Control group; HCD group; PCA-H, HCD + PCA 100 μg/mL; HSYA-H, HCD + HSYA 100 μg/mL; PCA + HSYA-H, HCD + PCA 100 μg/mL + HSYA 100 μg/mL. The flow activity of zebrafish larvae in the (A)Control, (B)HCD, (C)PCA-H, (D)HSYA-H and (E)PCA + HSYA-H groups. (F)Histogram representation of flow activity. ###P < 0.001, in comparison with the Control group, and the error bars represent SD.
Acknowledgments
This image is the copyrighted work of the attributed author or publisher, and
ZFIN has permission only to display this image to its users.
Additional permissions should be obtained from the applicable author or publisher of the image.
Full text @ Heliyon