
|
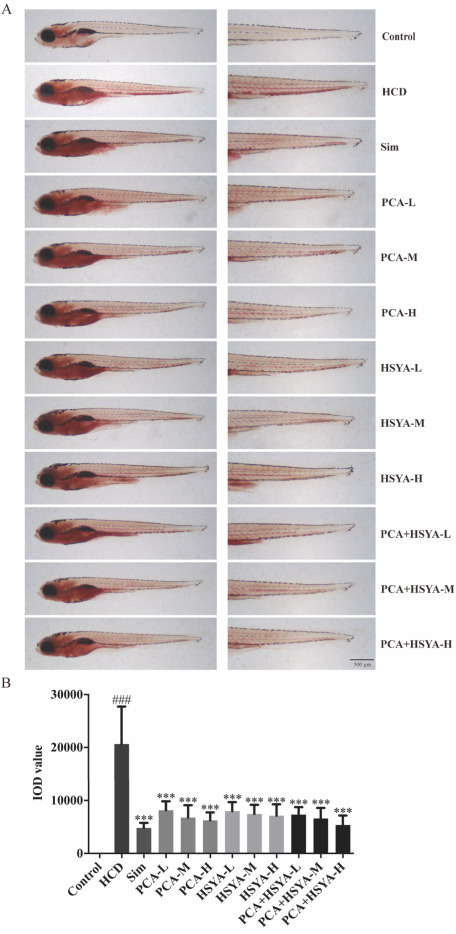
Fig. 2 Sim, PCA, HSYA and PCA + HSYA all decreased lipid accumulation in the caudal vein. (A) Oil red O staining of zebrafish larvae. (B)IOD values. The Control group; HCD group; PCA-L, HCD + PCA 25 μg/mL; PCA-M, HCD + PCA 50 μg/mL; PCA-H, HCD + PCA 100 μg/mL; HSYA-L, HCD + HSYA 25 μg/mL; HSYA-M, HCD + HSYA 50 μg/mL; HSYA-H, HCD + HSYA 100 μg/mL; PCA + HSYA-L, HCD + PCA 25 μg/mL + HSYA 25 μg/mL; PCA + HSYA-M, HCD + PCA 50 μg/mL + HSYA 50 μg/mL; PCA + HSYA-H, HCD + PCA 100 μg/mL + HSYA 100 μg/mL ###P < 0.001, in comparison with the Control group. ***P < 0.001, in comparison with the HCD group, and the error bars represent SD. Magnification: (A)20 × and 45 × .