
Image
|
Figure Caption
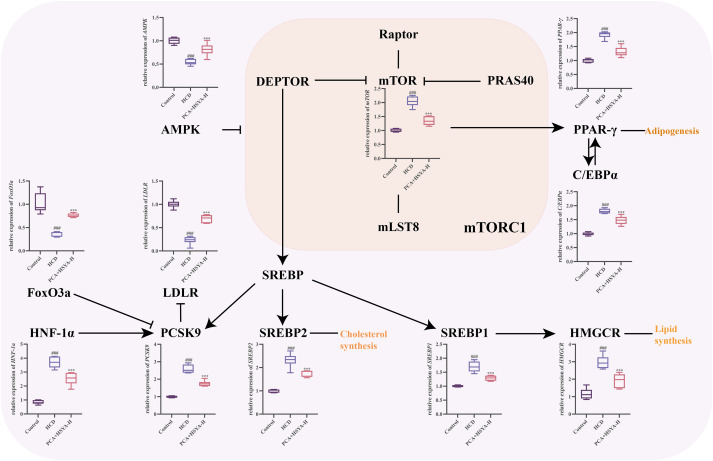
Fig. 9 Relative mRNA expression in zebrafish groups. The Control group; HCD group; PCA-H, HCD + PCA 100 μg/mL; HSYA-H, HCD + HSYA 100 μg/mL; PCA + HSYA-H, HCD + PCA 100 μg/mL + HSYA 100 μg/mL. Relative mRNA expression of SREBP2, SREBP1, AMPK, PCSK9, LDLR, HMGCR, PPAR-γ, C/EBPα, mTOR, HNF-1α and FoxO3a. ###P < 0.001, in comparison to the Control group. ***P < 0.001, in comparison to the HCD group.
Acknowledgments
This image is the copyrighted work of the attributed author or publisher, and
ZFIN has permission only to display this image to its users.
Additional permissions should be obtained from the applicable author or publisher of the image.
Full text @ Heliyon