
Image
|
Figure Caption
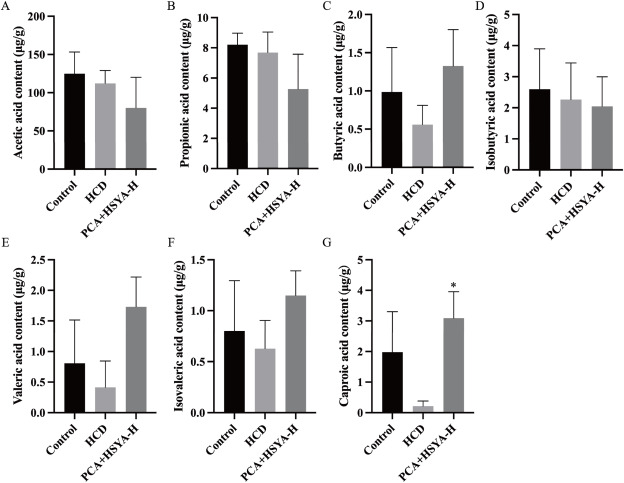
Fig. 8 Contents of SCFAs in zebrafish larvae. The Control group; HCD group; PCA-H, HCD + PCA 100 μg/mL; HSYA-H, HCD + HSYA 100 μg/mL; PCA + HSYA-H, HCD + PCA 100 μg/mL + HSYA 100 μg/mL (A)Acetic acid, (B)propionic acid, (C)butyric acid, (D)isobutyric acid, (E)valeric acid, (F)isovaleric acid and (G)caproic acid. *P < 0.05, in comparison with the HCD group, and the error bars represent SD.
Acknowledgments
This image is the copyrighted work of the attributed author or publisher, and
ZFIN has permission only to display this image to its users.
Additional permissions should be obtained from the applicable author or publisher of the image.
Full text @ Heliyon