
|
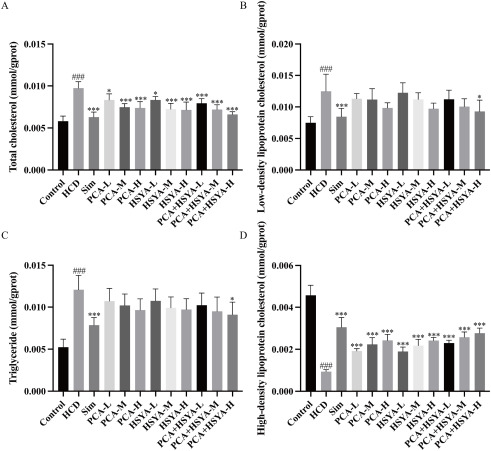
Fig. 3 Effects of PCA, HSYA and PCA + HSYA administration on HCD-induced hyperlipidemia in zebrafish larvae. The Control group; HCD group; PCA-L, HCD + PCA 25 μg/mL; PCA-M, HCD + PCA 50 μg/mL; PCA-H, HCD + PCA 100 μg/mL; HSYA-L, HCD + HSYA 25 μg/mL; HSYA-M, HCD + HSYA 50 μg/mL; HSYA-H, HCD + HSYA 100 μg/mL; PCA + HSYA-L, HCD + PCA 25 μg/mL + HSYA 25 μg/mL; PCA + HSYA-M, HCD + PCA 50 μg/mL + HSYA 50 μg/mL; PCA + HSYA-H, HCD + PCA 100 μg/mL + HSYA 100 μg/mL. Histogram of (A)TC, (B)LDL-C, (C)TG and (D)HDL-C in zebrafish larvae. ###P < 0.001, in comparison with the Control group. *P < 0.05, ***P < 0.001, compared with the HCD group, and the error bars represent SD.