
Image
|
Figure Caption
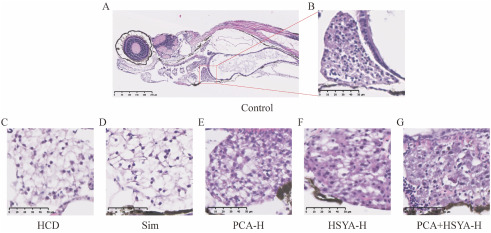
Fig. 7 Pathological observation of the liver in each group of zebrafish larvae. The Control group; HCD group; PCA-H, HCD + PCA 100 μg/mL; HSYA-H, HCD + HSYA 100 μg/mL; PCA + HSYA-H, HCD + PCA 100 μg/mL + HSYA 100 μg/mL (A-B)Control, (C)HCD, (D)Sim, (E)PCA-H, (F)HSYA-H and (G)PCA + HSYA-H groups. Magnification: (A)100 × and (B–G)400 × .
Acknowledgments
This image is the copyrighted work of the attributed author or publisher, and
ZFIN has permission only to display this image to its users.
Additional permissions should be obtained from the applicable author or publisher of the image.
Full text @ Heliyon