
- Title
-
Donepezil-Loaded Nanocarriers for the Treatment of Alzheimer's Disease: Superior Efficacy of Extracellular Vesicles Over Polymeric Nanoparticles
- Authors
- Oliveira Silva, R., Counil, H., Rabanel, J.M., Haddad, M., Zaouter, C., Ben Khedher, M.R., Patten, S.A., Ramassamy, C.
- Source
- Full text @ Int. J. Nanomedicine
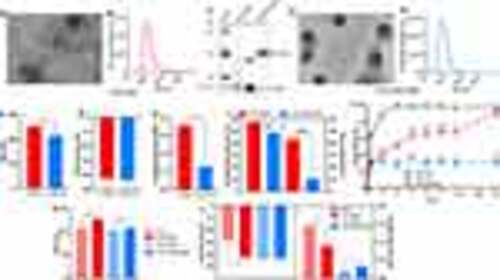
Characterization of EVs-DNZ and synthetic NPs-PLA-PEG-DNZ. (A and D) A representative TEM image of EVs-DNZ and NPs-PLA-PEG-DNZ. Scale bar, 100 nm. (B, E, and F) Size distribution of EVs-DNZ and NPs-PLA-PEG-DNZ measured by NTA. (C) Western blot analysis of EVs isolated from human plasma and cell lysates to confirm the expression of the EVs marker proteins CD63, TSG101, and Calnexin (as negative control). (G) Zeta potential, (H) PDI, and (I) encapsulation efficiency and drug loading of EVs-DNZ and NPs-PLA-PEG-DNZ. Data are shown as mean ± SEM. n = 3 per group, unpaired t-test. (J) In vitro drug release study of free DNZ, EVs-DNZ, and NPs-PLA-PEG-DNZ. Data are presented as mean ± SEM (n = 3 per group) with *p < 0.05, **p < 0.01, ***p< 0.001, and ****p < 0.0001 vs free DNZ; and #p < 0.05, ##p < 0.01 vs NPs-PLA-PEG-DNZ. (K and L) Effect of drug encapsulation on size, zeta potential, and PDI. Data are presented as mean ± SEM (n=3). |
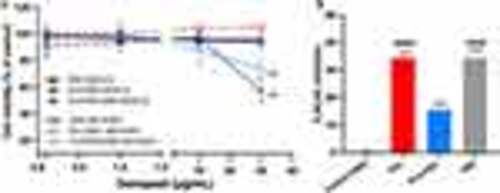
Evaluation of cell viability and AChE activity in neuronal cells. (A) bEnd.3 and SK-N-SH cells viability after treatment with different concentrations of free DNZ, EVs-DNZ, and NPs-PLA-PEG-DNZ for 24h as determined by resazurin assay. Data presented are mean ± SEM (n = 6), **p < 0.01 vs control without treatment. (B) Effect of formulations on AChE inhibition in neuronal cells (SK-N-SH). Inhibition of the enzyme activity in percentage of the control group without treatment with n = 3 per group. ****p < 0.0001 vs control and ####p < 0.0001 vs PLA-PEG. |
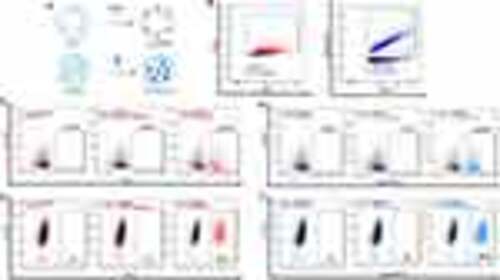
Uptake of EVs and NPs-PLA-PEG by bEnd.3 and SK-N-SH cells. (A) Schematic representation of staining of EVs and NPs-PLA-PEG by PKH26 and Cy5, respectively. Created with BioRender.com. (B) Representative of nFCM fluorescence intensity resulting from staining EVs with PKH26 (red) or NPs-PLA-PEG with Cy5 (blue). Black signal resulted from EVs and NPs-PLA-PEG without fluorescence labelling (control). Flow cytometric analysis of EVs-PKH26 or NPs-PLA-PEG-Cy5 uptake by bEnd.3 (C and D) and SK-N-SH (E and F) cells after 24h of incubation. Controls represent cells that were not incubated with any formulation (untreated). The filtrate from the last wash after labeling and the unlabeled nanoformulations (EVs and NPs-PLA-PEG) were used to determine the background. The percentages of PKH26 and Cy5 positive cells are indicated inside the gates. |

Transcytosis efficacy of nanoformulations through the bEnd.3 cells and their uptake by SK-N-SH cells. (A) Schematic representation of the experimental design with the bEnd.3 cells monolayer cultured in the upper chamber (apical) of the insert Transwell® with 1 μm membrane pores and SK-N-SH cells seeded on the bottom of the basal compartment (the “brain side” of the Transwell®). Fluorescent formulations were added in the apical chamber at the equivalent concentration of 1.2 × 10¹⁰ particles and incubated for 24 h. Created with BioRender.com. (B) Flow cytometry plots indicating the percentage of nanoformulations (EVs-PKH26 and NPs-PLA-PEG-Cy5) taken-up by SK-N-SH after 24 h of incubation; the percentages of PKH26-positive or Cy5-positive cells are indicated inside the gates. (C) bar graph representing the quantification of the EVs-PKH26 (in red) and NPs-PLA-PEG-Cy5 (in blue) uptake and control cells (in black) were without nanoformulation. Data presented are mean ± SEM (n = 6). ***p < 0.001 vs control and ####p < 0.0001 vs control and EVs-PKH26. (D) Bivariate dot plots of PE (PKH26) and Cy5 fluorescence versus SSC of the nanoformulations (EVs-PKH26 and NPs-PLA-PEG-Cy5) present in the culture medium of the basal compartment of the Transwell®). (E) Quantification of nanoformulations in suspension in the basal medium after 24h of incubation. Data shown are mean ± SEM (n = 5), ****p < 0.0001 vs control and EVs-PKH26. (F) Representative fluorescence images showing the uptake of EVs-PKH26 and NPs-PLA-PEG-Cy5 by bEnd.3 cells (monolayer grown on the insert filter) after 24h incubation. EVs-PKH26 and NPs-PLA-PEG-Cy5 appear in red; core, blue; and claudin-5 (in green). Scale bar, 30 μm. Orthogonal views of 3D image stacks confirm the uptake of EVs-PKH26 (G) and NPs-PLA-PEG-Cy5 (H) in bEnd.3 cells. Scale bar, 60 μm. |
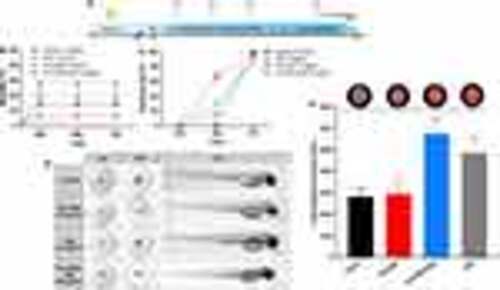
Acute toxicity in the zebrafish embryo and larval behavior test. (A) Timeline of the experiments. Created with BioRender.com. (B) Mortality (%) and (C) hatching (%) of zebrafish embryos from the control group and after exposure to 10 μg/mL DNZ, EVs-DNZ, and NPs-PLA-PEG-DNZ containing an equivalent of 10 μg/mL of DNZ during 72 h. (D) Representative morphology of zebrafish embryos exposed to the nanoformulations. (E) The locomotor activity of zebrafish larvae on the sixth day after treatment with the free drug DNZ, or both nanoformulations. Tests were performed from 3 replicate trials using 10 embryos at each dose. Values are expressed as mean ± SEM, *p < 0.05 vs control. One-way ANOVA followed by Tukey as a post hoc comparison |

In vivo biodistribution of nanoformulations in zebrafish embryos and acetylcholinesterase activity in the head. (A) Scheme showing the injection site (i.v.) in embryonic zebrafish (48 hpf) and imaging period. NPs-PLA-PEG-Cy5 and EVs-PKH26 were microinjected into the Tg (flk1:EGFP) zebrafish larvae at a dose equivalent to 7.92×10⁵ NPs (4nL). Vascular endothelial cells are in green and labeled nanoformulations are in red. The nanoformulations were screened for in vivo distribution after 24h in the lateral position. Created with BioRender.com. (B and C) Whole embryo (10× magnification) and head-level (20× magnification) views of EVs-PKH26 biodistribution. EVs-PKH26 remains associated with the dorsal region of the embryo. Bright red dots were observed in the brain region of the larvae, corresponding to EVs-PKH26. The gray dots correspond to the presence of nanoformulations in the respective regions. (D and E) Whole embryos and head-level views of biodistribution. NPs-PLA-PEG-Cy5 predominantly circulated freely and was distributed throughout the vasculature of the embryo. High levels of NPs-PLA-PEG-Cy5 were confined to the vasculature but low level in the brain parenchyma (gray). Scale bars: 200µm (whole embryo) and 100µm (head). (F) Schematic representation of the injection and AChE activity analysis. Created with BioRender.com. (G) Effect of nanoformulations on the inhibition of the AChE activity in the zebrafish brain. The percentage of inhibition values was calculated in comparison to the activity of the control group without treatment. Data presented are mean ± SEM (n=3), six fish per sample. ***p <0.001, ****p < 0.0001 vs control, ###p < 0.001, ####p < 0.0001 vs DNZ, and $p < 0.05 vs NPs-PLA-PEG. One-way ANOVA followed by Tukey’s post hoc test. |