
- Title
-
Effects and mechanisms of Porphyromonas gingivalis outer membrane vesicles induced cardiovascular injury
- Authors
- Guo, J., Lin, K., Wang, S., He, X., Huang, Z., Zheng, M.
- Source
- Full text @ BMC Oral Health

Characterization of |

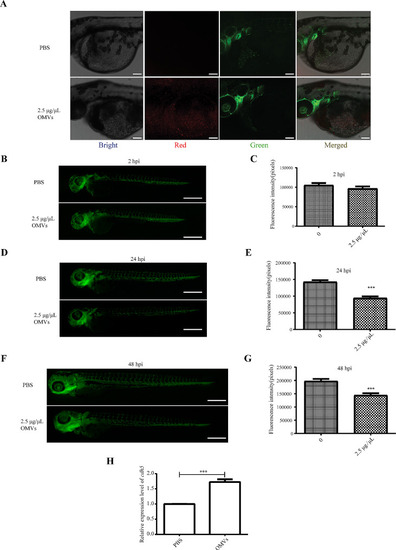
Analysis of the impact of |
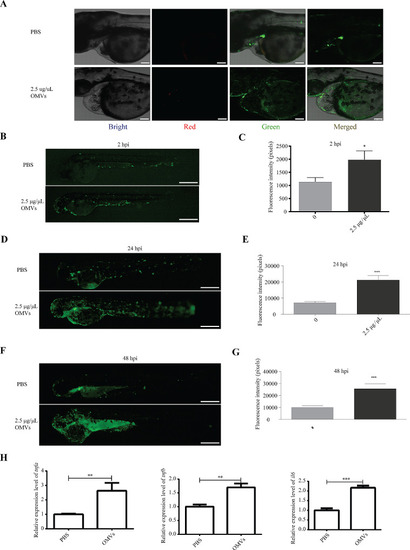
Analysis of the impact of |

Analysis of the impact of |
Analysis of the impact of |
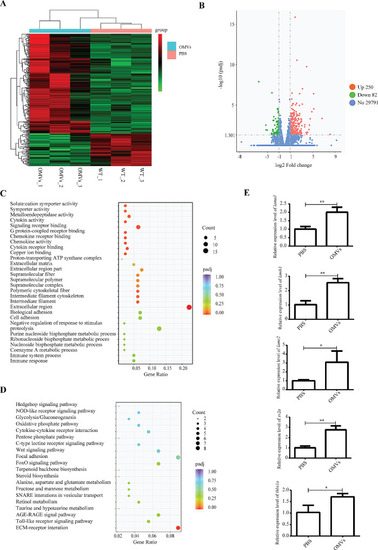
Transcriptomics results and validation. ( |