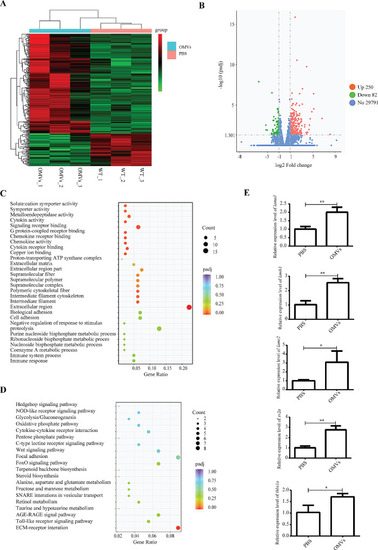
Transcriptomics results and validation. (A) Heat map analysis for RNA-seq data of samples at 48 hpi from the zebrafish larvae injected with PBS and P. gingivalis OMVs. (B) Volcano plot of differential expression analysis of PBS and P. gingivalis OMVs treated zebrafish larvae showing the relationship between P-value and log fold changes. Red shows upregulated genes and blue downregulated genes. Relative to the control, 332 differentially expressed genes (DEGs), including 250 up-regulated and 82 down-regulated, were identified. (C) Scatterplot of enriched top 30 GO pathways for DEGs. The Y-axis represented the GO pathways, and the X-axis represented the Rich factor. (D) Scatterplot of enriched top 20 KEGG pathways for DEGs. The Y-axis represented the KEGG pathways, and the X-axis represented the Rich factor. (E) Expression results of lama3, lamb3, lamc2, sv2a and thbs1a genes in 48 hpi zebrafish larvae. The relative change of mRNA levels was calculated by the 2 − ΔΔCt method and β-actin. Data were shown as the mean ± standard deviation (SD), and P values < 0.05 were considered statistically significant, *p < 0.05, **p < 0.01, ***p ≤ 0.001
|
