IMAGE

Fig. 4

ID
ZDB-IMAGE-240122-20
Source
Figures for Guo et al., 2024
Image
Figure Caption

Fig. 4

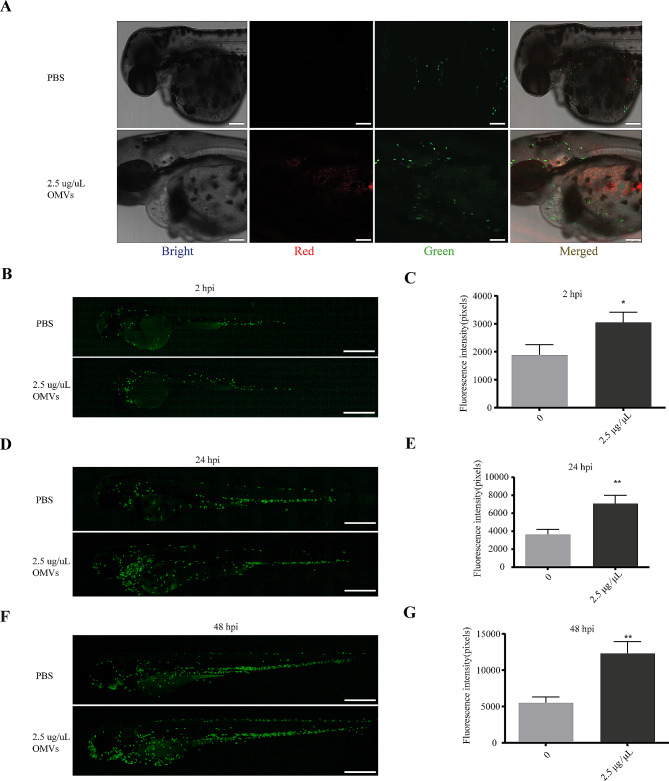
Analysis of the impact of P. gingivalis OMVs on the neutrophils. (A) Representation of confocal image at 0 hpi with microinjection of PBS or 2.5 µg/µL P. gingivalis OMVs in that heart region of the body. Bright, Bright channel, Red, P. gingivalis OMVs; Green, neutrophils. Scale bar: 100 μm. (B) Image of neutrophils fluorescence at 2 hpi after treated with PBS or 2.5 µg/µL P. gingivalis OMVs. Live imaging was performed under a stereoscopic fluorescence microscope (SMZ800N) in the green channel. Scale bar: 0.5 mm. (C) Analysis results of neutrophils fluorescence according to picture taken in Fig. 4B. n = 15, each group being replicated thrice. The unit is pixel, Mann Whitney test was used to analyze the significant difference between groups. *p < 0.05. (D) Image of neutrophils fluorescence at 24 hpi after treated with PBS or 2.5 µg/µL P. gingivalis OMVs. Scale bar: 0.5 mm. (E) Analysis results of neutrophils fluorescence according to picture taken in Fig. 4D. n = 15, each group being replicated thrice. Mann Whitney test was used to analyze the significant difference between groups, **p < 0.01. (F) Image of neutrophils fluorescence at 48 hpi after treated with PBS or 2.5 µg/µL P. gingivalis OMVs. Scale bar: 0.5 mm. (G) Analysis results of neutrophils fluorescence according to picture taken in Fig. 4F. n = 15, each group being replicated thrice. Mann Whitney test was used to analyze the significant difference between groups, **p < 0.01

Acknowledgments
This image is the copyrighted work of the attributed author or publisher, and ZFIN has permission only to display this image to its users. Additional permissions should be obtained from the applicable author or publisher of the image. Full text @ BMC Oral Health