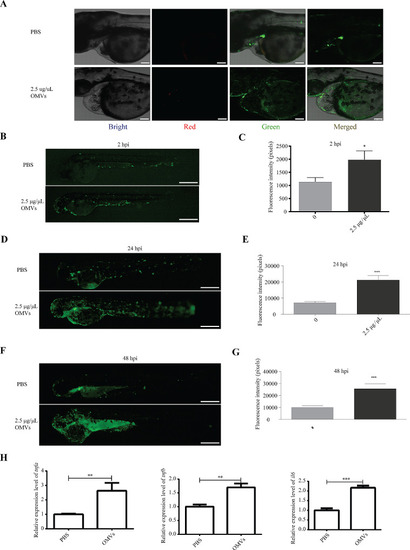
Analysis of the impact of P. gingivalis OMVs on the nfκb signaling pathway. (A) Representation of confocal image at 0 hpi with microinjection of PBS or 2.5 µg/µL P. gingivalis OMVs in that heart region of the body. Bright, Bright channel, Red, P. gingivalis OMVs; Green, nfκb signaling. Scale bar: 100 μm. (B) Image of green fluorescence at 2 hpi after treated with PBS or 2.5 µg/µL P. gingivalis OMVs. Live imaging was performed under a stereoscopic fluorescence microscope (SMZ800N) in the green channel. Scale bar: 0.5 mm. (C) Analysis results of green fluorescence according to picture taken in Fig. 5B. n = 15, each group being replicated thrice. The unit is pixel, Mann Whitney test was used to analyze the significant difference between groups. *p < 0.05. (D) Image of green fluorescence at 24 hpi after treated with PBS or 2.5 µg/µL P. gingivalis OMVs. Scale bar: 0.5 mm. (E) Analysis results of green fluorescence according to picture taken in Fig. 5D. n = 15, each group being replicated thrice. Mann Whitney test was used to analyze the significant difference between groups, ***p ≤ 0.001. (F) Image of green fluorescence at 48 hpi after treated with PBS or 2.5 µg/µL P. gingivalis OMVs. Scale bar: 0.5 mm. (G) Analysis results of green fluorescence according to picture taken in Fig. 5F. n = 15, each group being replicated thrice. Mann Whitney test was used to analyze the significant difference between groups, ***p ≤ 0.001. (H) Expression results of tnfa, tnfb and il6 genes in 48 hpi zebrafish larvae. The relative change of mRNA levels was calculated by the 2 − ΔΔCt method and β-actin. Data were shown as the mean ± standard deviation (SD), and P values < 0.05 were considered statistically significant, **p < 0.01, ***p ≤ 0.001
|
