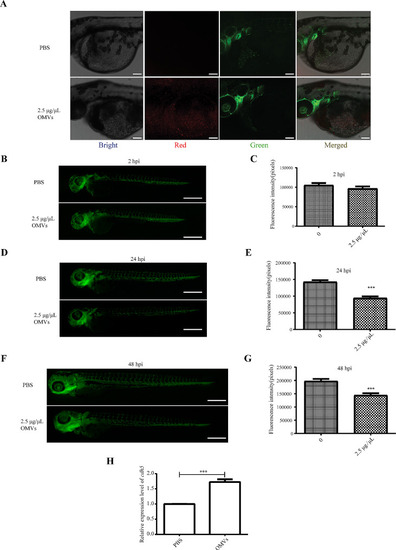
Analysis of the impact of P. gingivalis OMVs on the vascular system. (A) Representation of confocal image of zebrafish larver at 0 hpi with microinjection of PBS or 2.5 µg/µL P. gingivalis OMVs in that heart region of the body. Bright, Bright channel, Red, P. gingivalis OMVs; Green, vascular endothelial cells. Scale bar: 100 μm. (B) Image of vascular fluorescence at 2 hpi after treated with PBS or 2.5 µg/µL P. gingivalis OMVs. Live imaging was performed under a stereoscopic fluorescence microscope (SMZ800N) in the green channel. Scale bar: 0.5 mm. (C) Analysis results of vascular fluorescence according to picture taken in Fig. 3B. n = 15, each group being replicated thrice. The unit is pixel, Mann Whitney test was used to analyze the significant difference between groups. (D) Image of vascular fluorescence at 24 hpi after treated with PBS or 2.5 µg/µL P. gingivalis OMVs. Scale bar: 0.5 mm. (E) Analysis results of vascular fluorescence according to picture taken in Fig. 3D. n = 15, each group being replicated thrice. Mann Whitney test was used to analyze the significant difference between groups, ***p ≤ 0.001. (F) Image of vascular fluorescence at 48 hpi after treated with PBS or 2.5 µg/µL P. gingivalis OMVs. Scale bar: 0.5 mm. (G) Analysis results of vascular fluorescence according to picture taken in Fig. 3F. n = 15, each group being replicated thrice. Mann Whitney test was used to analyze the significant difference between groups, ***p ≤ 0.001. (H) Expression results of cdh5 genes in 48 hpi zebrafish larvae. The relative change of mRNA levels was calculated by the 2 − ΔΔCt method and β-actin. Data were shown as the mean ± standard deviation (SD), and P values < 0.05 were considered statistically significant, ***p ≤ 0.001
|
