
- Title
-
Evaluation of the efficacy of cystinosin supplementation through CTNS mRNA delivery in experimental models for cystinosis
- Authors
- Bondue, T., Berlingerio, S.P., Siegerist, F., Sendino-Garví, E., Schindler, M., Baelde, H.J., Cairoli, S., Goffredo, B.M., Arcolino, F.O., Dieker, J., Janssen, M.J., Endlich, N., Brock, R., Gijsbers, R., van den Heuvel, L., Levtchenko, E.
- Source
- Full text @ Sci. Rep.
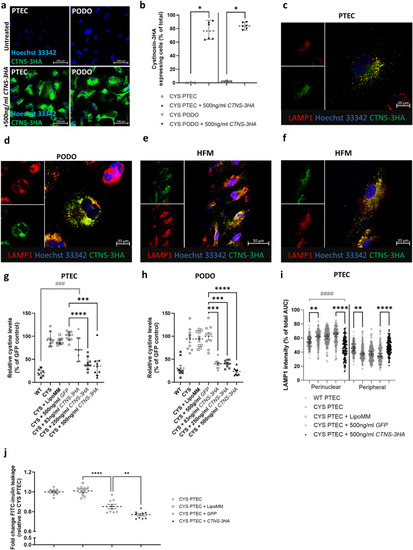
Transfection of cystinosis patient (CYS) derived proximal tubular epithelial cells (PTECs) and podocytes (PODOs) with |
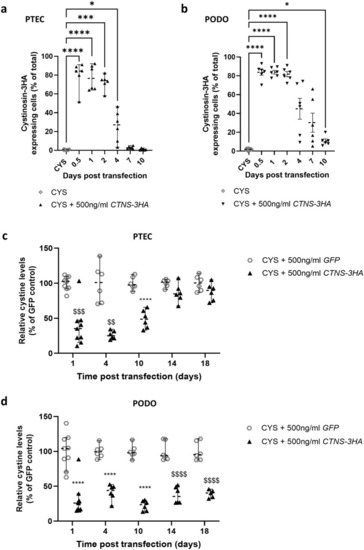
Transfection of cystinosis patient (CYS) derived proximal tubular epithelial cells (PTECs) and podocytes (PODOs) results in functional cystinosin-3HA expression for up to 4 and 10 days, and reduces cystine levels for up to 10 and 18 days, respectively. ( |
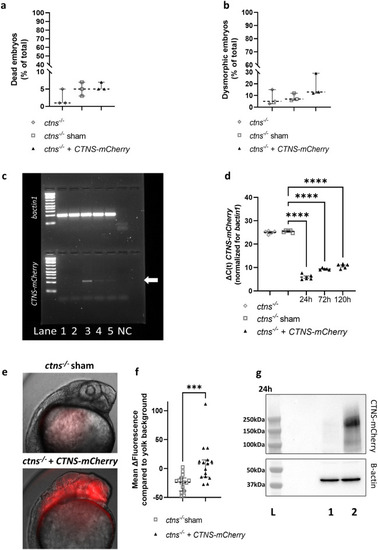
Injection of human |
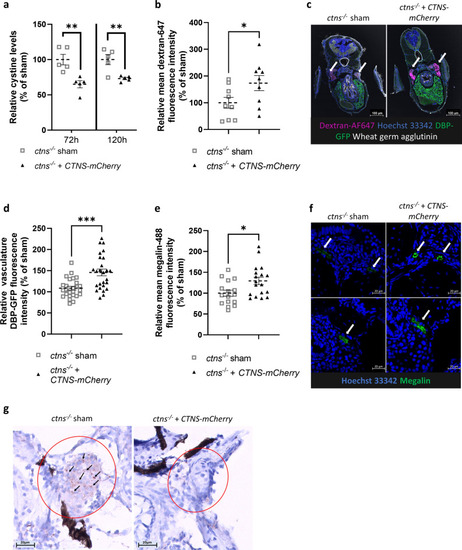
Injection of human |