IMAGE

Figure 1

ID
ZDB-IMAGE-231130-60
Source
Figures for Bondue et al., 2023
Image
Figure Caption

Figure 1

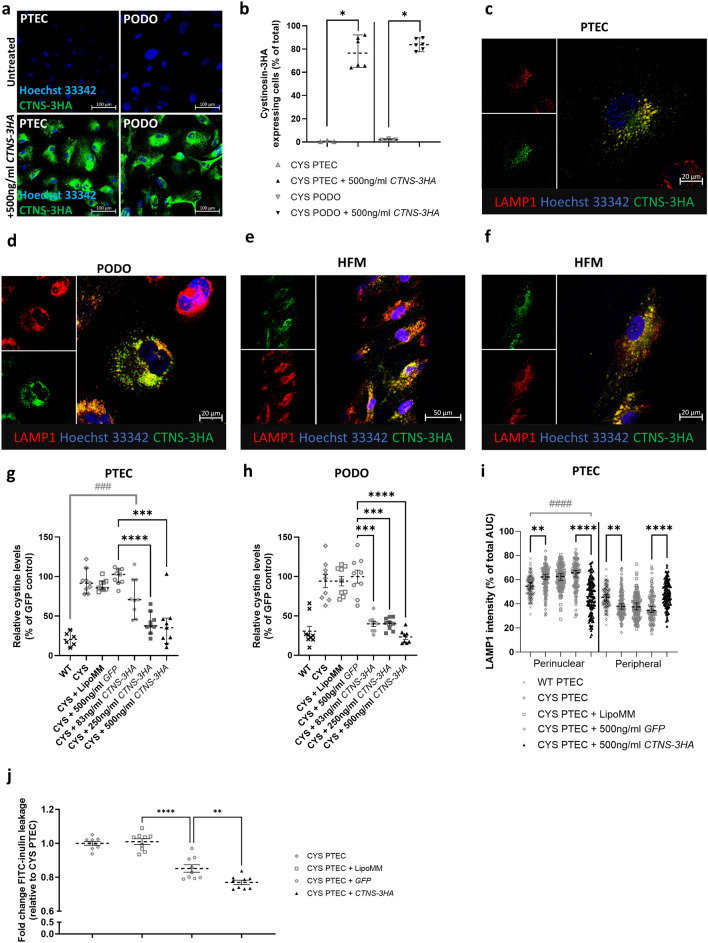
Transfection of cystinosis patient (CYS) derived proximal tubular epithelial cells (PTECs) and podocytes (PODOs) with CTNS-3HA mRNA results in lysosomal expression of cystinosin-3HA, reduction of cystine levels and reduced inulin leakage at 24 h post-transfection. (a) Cystinosin-3HA expression (green) after transfection of CYS PTECs and PODOs with 500 ng/ml CTNS-3HA mRNA (bottom) as compared with untreated cells (top). Scale bar = 100 µm. (b) Quantification of PTECs and PODOs expressing cystinosin-3HA in randomly acquired microscopical fields (each dot is one field from 3 independent experiments). Images were obtained using a Operetta CLS High Content Screening Microscope. Median and 95% CI are indicated. Data were analysed with Mann–Whitney tests. *p < 0.05. (c–f) Lysosomal localization was demonstrated at 24 h post-transfection by co-staining of cystinosin-3HA (green) with LAMP1 (red) in confocal images in a 2D cell model (c,d) (scale bar = 20 µm) and in PTECs on the hollow fiber membranes (HFM—e,f) (scale bar = 50 µm and 20 µm). (g,h) Reduction of lysosomal cystine accumulation in PTECs (g) and PODOs (h) at 24h post-transfection with increasing concentrations of CTNS-3HA mRNA. Cellular cystine levels were analysed by LC–MS. CTNS-3HA mRNA treated cells were compared with the GFP control using Kruskal Wallis test (PTECs) and Welch’s ANOVA (PODOs) (*). A second comparison between the transfected cells and wildtype control (Kruskal–Wallis—#) was performed. Median and 95% CI are represented for PTECs and mean with SEM for PODOs (n = 3 independent experiments). *p < 0.05; ***,###p < 0.001; ****p < 0.0001. (i) At 24 h post-transfection, cells treated with CTNS-3HA mRNA show a reduced perinuclear LAMP1 signal (% of total, Kruskal–Wallis test—*). The (peripheral) distribution in the CTNS-3HA treated PTECs was comparable to the wildtype control (Kruskal–Wallis test—#) (n = 120 cells). Median with 95% CI is indicated. **p < 0.01; ****,####p < 0.0001. (i) The fold change leakage of FITC-inulin (relative to untreated PTECs) was evaluated in PTECs cultured on the hollow fiber membranes at 24 h post-transfection (n = 3 biological replicates). Data were evaluated with an one-way ANOVA. Mean and SEM are shown. **p < 0.01; ****p < 0.01.

Acknowledgments
This image is the copyrighted work of the attributed author or publisher, and ZFIN has permission only to display this image to its users. Additional permissions should be obtained from the applicable author or publisher of the image. Full text @ Sci. Rep.