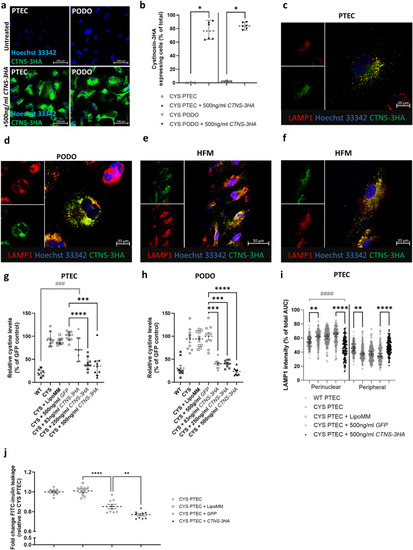
Transfection of cystinosis patient (CYS) derived proximal tubular epithelial cells (PTECs) and podocytes (PODOs) with CTNS-3HA mRNA results in lysosomal expression of cystinosin-3HA, reduction of cystine levels and reduced inulin leakage at 24 h post-transfection. (a) Cystinosin-3HA expression (green) after transfection of CYS PTECs and PODOs with 500 ng/ml CTNS-3HA mRNA (bottom) as compared with untreated cells (top). Scale bar = 100 µm. (b) Quantification of PTECs and PODOs expressing cystinosin-3HA in randomly acquired microscopical fields (each dot is one field from 3 independent experiments). Images were obtained using a Operetta CLS High Content Screening Microscope. Median and 95% CI are indicated. Data were analysed with Mann–Whitney tests. *p < 0.05. (c–f) Lysosomal localization was demonstrated at 24 h post-transfection by co-staining of cystinosin-3HA (green) with LAMP1 (red) in confocal images in a 2D cell model (c,d) (scale bar = 20 µm) and in PTECs on the hollow fiber membranes (HFM—e,f) (scale bar = 50 µm and 20 µm). (g,h) Reduction of lysosomal cystine accumulation in PTECs (g) and PODOs (h) at 24h post-transfection with increasing concentrations of CTNS-3HA mRNA. Cellular cystine levels were analysed by LC–MS. CTNS-3HA mRNA treated cells were compared with the GFP control using Kruskal Wallis test (PTECs) and Welch’s ANOVA (PODOs) (*). A second comparison between the transfected cells and wildtype control (Kruskal–Wallis—#) was performed. Median and 95% CI are represented for PTECs and mean with SEM for PODOs (n = 3 independent experiments). *p < 0.05; ***,###p < 0.001; ****p < 0.0001. (i) At 24 h post-transfection, cells treated with CTNS-3HA mRNA show a reduced perinuclear LAMP1 signal (% of total, Kruskal–Wallis test—*). The (peripheral) distribution in the CTNS-3HA treated PTECs was comparable to the wildtype control (Kruskal–Wallis test—#) (n = 120 cells). Median with 95% CI is indicated. **p < 0.01; ****,####p < 0.0001. (i) The fold change leakage of FITC-inulin (relative to untreated PTECs) was evaluated in PTECs cultured on the hollow fiber membranes at 24 h post-transfection (n = 3 biological replicates). Data were evaluated with an one-way ANOVA. Mean and SEM are shown. **p < 0.01; ****p < 0.01.
|
