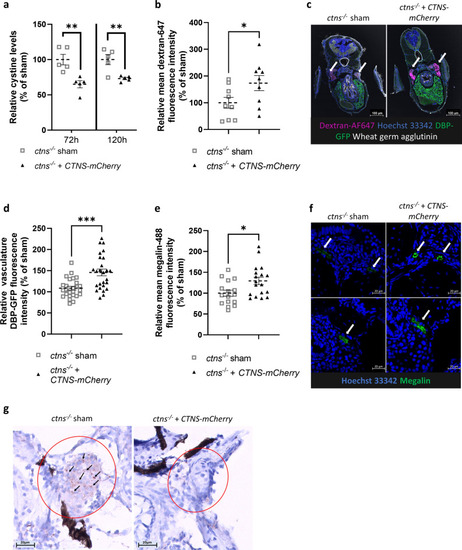
Injection of human CTNS-mCherry mRNA in fertilized eggs of ctns−/− zebrafish decreases cystine accumulation, restores tubular reabsorption and alleviates glomerular proteinuria. (a) Injected ctns−/− zebrafish larvae were collected in groups of 10–12 fish. Cystine levels in treated larvae were measured at 72 h and 120 h post-injection (n = 5 groups). Statistical analysis was performed using a Student’s t-test. Mean and SEM are indicated. **p < 0.01. (b,c) mRNA treated ctns−/−[Tg(l-fabp:DBP:eGFP)] larvae were injected with 10 kDa dextran-AF647 for evaluation of low molecular weight proteinuria (LMWP) at 72 h post-injection and fixed for cryosection after 16 h. Sections were stained with Hoechst 33342 (blue) and wheat germ agglutinin (WGA, white), with the DBP-GFP visible in the liver (green). Tubular intensity of dextran-AF647 fluorescence (magenta) was measured and used to quantify low molecular weight protein absorption. Data were analysed with a Student’s t-test and mean and SEM are indicated (n = 9 fish). Scale bar = 100 µm. *p < 0.05. (d) Glomerular proteinuria was evaluated in the ctns−/−[Tg(l-fabp:DBP:eGFP)] larvae at 120 h post-injection of CTNS-mCherry mRNA. Images were generated with the Acquifer imaging machine. For quantification, an automatized FIJI script was used within a mask determined by segmentation of blood vessels upon traversing blood cells. Data were analysed with a Welch’s t-test. Mean and SEM are indicated (n = 26 fish). ***p < 0.001. (e,f) Sections of injected ctns−/− fish were prepared at 72 h post-injection and stained for the megalin multi-ligand receptor on the proximal tubular brush border (green), with a nuclear counterstain (blue). Confocal images were obtained and Alexa-488 intensity was measured in each tubule (n = 8 fish) and showed the restauration of proximal tubular megalin expression in treated larvae. Statistical significance was tested using an Student’s t-test and mean and SEM are indicated. *p < 0.05. Scale bar = 20 µm. (g) Paraffin sections of embryos at 120 h post-injection were stained for cleaved caspase-3 and the proximal tubulus identified (red circle). High signal spots are accentuated by an arrow. Scale bar = 20 µm.
|
