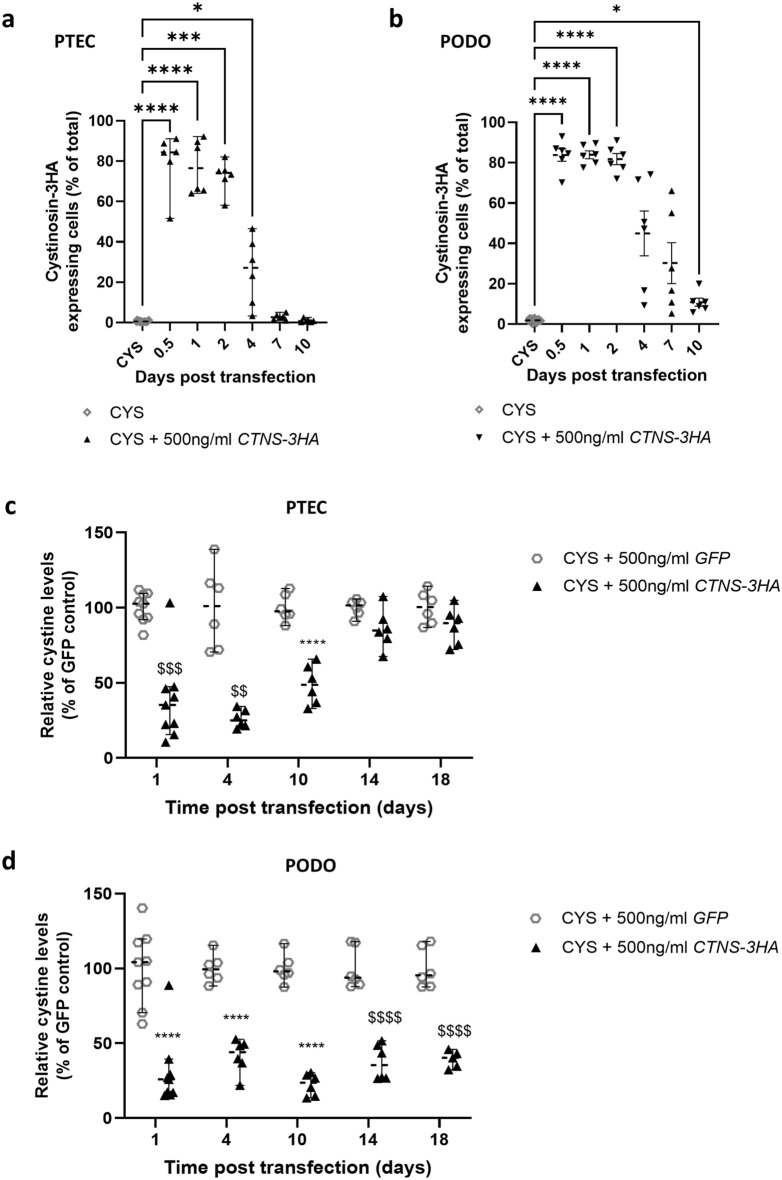
IMAGE

Figure 2

ID
ZDB-IMAGE-231130-61
Source
Figures for Bondue et al., 2023
Image
Figure Caption

Figure 2

Transfection of cystinosis patient (CYS) derived proximal tubular epithelial cells (PTECs) and podocytes (PODOs) results in functional cystinosin-3HA expression for up to 4 and 10 days, and reduces cystine levels for up to 10 and 18 days, respectively. (a,b) Time course of cystinosin-3HA expression in PTECs (a) and PODOs (b). Images were obtained using the Operetta CLS High Content Screening Microscope and percentage of cells with detectable cystinosin-3HA expression quantified (each dot represents one observed field from 3 independent experiments). Data were analysed using a Kruskal Wallis test (PTECs) and Welch’s ANOVA test (PODOs). Median and 95% CI are represented for PTECs, and mean and SEM are shown for the PODOs. *p < 0.05; ***p < 0.001; ****p < 0.0001. (c,d) Time course of cystine reduction in CYS PTECs (c) and PODOs (d) that were transfected with CTNS-3HA mRNA. Cystine levels were measured at 4, 10, 14 and 18 days post-transfection and were expressed as percentage (%) of levels measured in cells transfected with GFP mRNA. Each dot represents a replicate, coming from 2 independent transfections. Statistical significance was evaluated using individual tests for each time point, one-way ANOVA (****p < 0.001) and Kruskal Wallis test ($$p < 0.01; $$$p < 0.001; $$$$p < 0.0001). Median and 95% CI are indicated for all time points.

Acknowledgments
This image is the copyrighted work of the attributed author or publisher, and ZFIN has permission only to display this image to its users. Additional permissions should be obtained from the applicable author or publisher of the image. Full text @ Sci. Rep.