FIGURE SUMMARY
Title

Molecular basis of retinal remodeling in a zebrafish model of retinitis pigmentosa

Authors
Santhanam, A., Shihabeddin, E., Wei, H., Wu, J., O'Brien, J.
Source
Full text @ Cell. Mol. Life Sci.

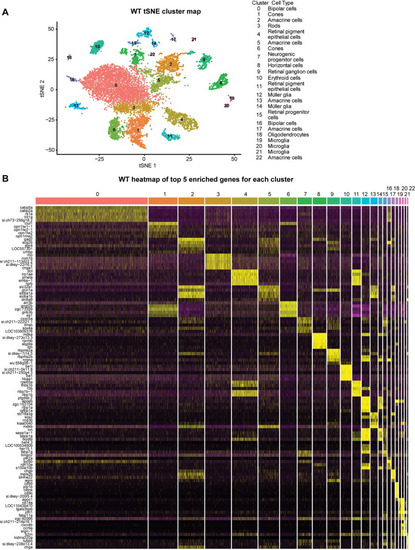
Single-cell RNA seq analysis of WT zebrafish retina. A tSNE dimensionality reduction and visualization of transcriptional profiles of 13,552 retinal cells from WT zebrafish. B Heatmap showing the top 5 genes enriched for each cluster

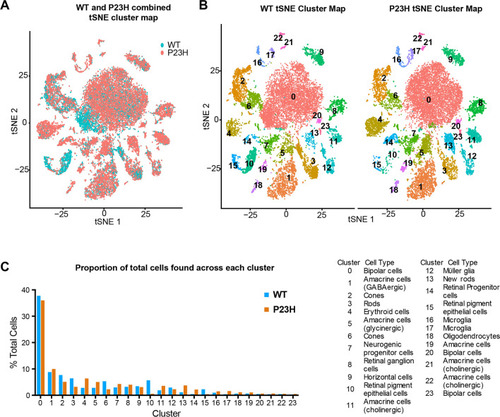
Single-cell RNA seq analysis of integrated WT-P23H zebrafish retina datasets. A Overlap of tSNE dimensionality reduction and visualization of single-cell transcriptomes from WT and P23H transgenic fish retina. B Separate display of P23H and WT tSNE maps from integrated data set with cell types labeled. C Relative proportions of each cell type found in the P23H and WT retinal samples

Transcriptomic analysis of rods and newly formed rods in the WT-P23H integrated dataset reveal an increased response to oxidative stress and misfolded proteins. A Overlap of UMAP dimensionality reduction and visualization of rod transcriptomes from WT and P23H transgenic fish. B Violin plots showing levels of expression of canonical marker genes in WT and P23H rods. CE Violin plots showing expression levels of differentially expressed genes (DEGs) involved in various functional pathways including oxidative stress, response to misfolded proteins, ciliary transport, synaptic remodeling, and metabolism in WT and P23H rods. F Dot plot showing the expression level and the percentage of cells expressing DEGs involved in different functional pathways in WT and P23H. G Violin plots showing expression levels of DEGs involved in proteasome and ubiquitin-mediated degradation pathway and stress response markers in WT and P23H newly formed rods

Comparative transcriptomic analysis of cones in WT-P23H integrated dataset reveals changes in metabolism and circadian regulation. A Violin plots showing levels of expression of short- and long-wavelength opsins in cone clusters 2 and 6. B Dot plot showing the expression level and the percentage of cells expressing DEGs involved in different metabolic functional pathways between WT and P23H. C Dot plot showing the expression level and the percentage of cells expressing DEGs involved in circadian regulation between WT and P23H. D Hiplex fluorescent in situ hybridization for tefa, per1, and per2 in sections of adult retina. The fluorescent product is shown in the left third of each image, while the remainder displays a binary mask in the fluorescent in situ hybridization product channel. All three genes show increased expression throughout the retina in P23H compared to WT, reflecting the changes captured by single-cell transcriptome analysis. Scale bar applies to all panels

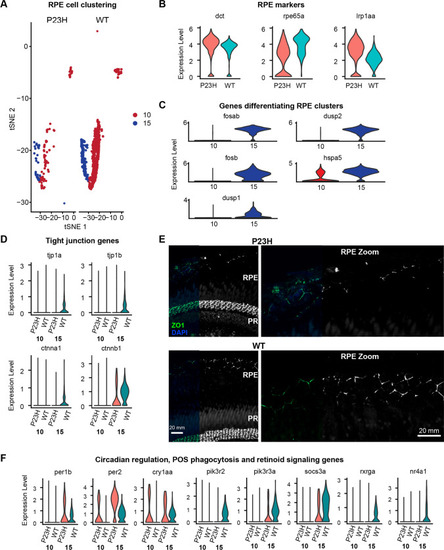
RPE transcriptome is altered in the RP model. A tSNE map showing the proportions of RPE cells found in the P23H and WT retinal samples. B Violin plots showing levels of expression of canonical RPE marker genes in WT and P23H RPE cells. C Violin plots showing expression levels of DEGs differentiating RPE clusters 10 and 15. D Violin plots showing expression levels of genes involved in tight junctions in WT and P23H RPE. E Immuno-fluorescent labeling of tight junction protein ZO1 in retina of adult P23H and WT zebrafish. The layer of retinal pigmented epithelium (RPE) is at the top. Additional strong ZO1 labeling below the photoreceptor inner segments (PR) is the outer limiting membrane formed by Müller cell end-feet tight junctions. Right panels show magnified view of ZO1 labeling in the RPE. Scale bars in WT apply to both WT and P23H. F Violin plots showing levels of expression of DEGs including those involved in circadian regulation, POS phagocytosis and retinoid signaling in WT and P23H RPE cells

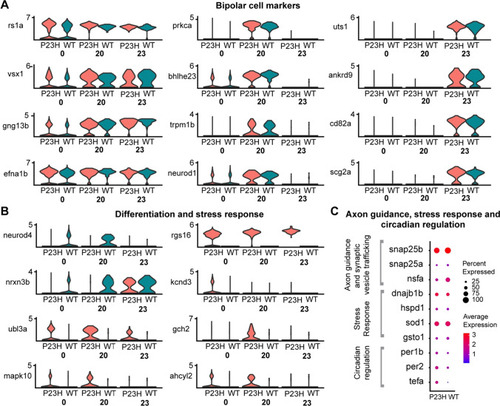
Comparative transcriptomic analysis of bipolar cell clusters in the WT-P23H integrated dataset shows evidence of stress and neuronal remodeling in the RP model. A Violin plots showing levels of expression of specific marker genes in different clusters of bipolar cells (0, 20, and 23). B Violin plots showing changes in expression of genes involved in differentiation and stress response in the three bipolar cell clusters. C Dot plot showing the expression level and the percentage of cells expressing DEGs involved in axon guidance, stress response and circadian regulation between WT and P23H in cluster 20

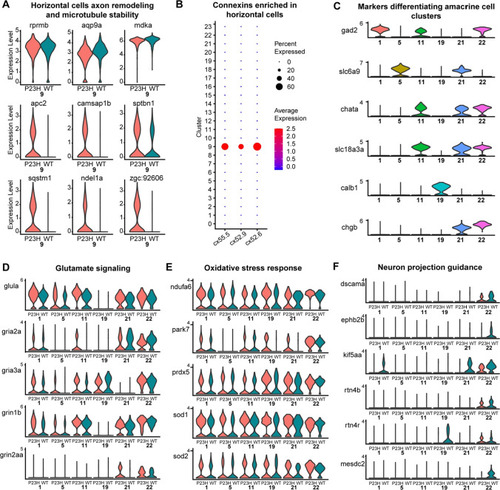
Transcriptomic analysis of Horizontal and Amacrine cells in the WT-P23H integrated dataset reveals changes in axon remodeling in the RP model. A, B Horizontal cells; CF Amacrine cells. A Violin plots showing levels of expression of canonical marker genes as well as DEGs involved in axon remodeling and microtubule stability in WT and P23H horizontal cells. B Dot plot showing the specific enrichment of cx52.6, cx52.9, and cx55.5 in horizontal cell cluster (9) compared to all other retinal cell types. C Our data identified six different types of amacrine clusters (1, 5, 11, 19, 21, and 22). Violin plots showing levels of expression of canonical marker genes expressed in different amacrine clusters. DF Violin plots showing levels of expression of DEGs involved in glutamate signaling (D), oxidative stress response (E), and neuron projection guidance (F) between WT and P23H amacrine cells

Comparative transcriptomic analysis of retinal ganglion cells in WT-P23H integrated dataset. A Dot plot showing the specific enrichment of canonical markers pou4f1, rbpms2a and rbpms2b in the RGC cluster compared to all other retinal cell types. rbpms2a and rbpms2b are present at lower levels in Müller glial cells (12) as well. B Dot plot showing the expression level and the percentage of cells expressing DEGs involved in different functional pathways between WT and P23H. C, D Violin plots showing increased levels of expression of DEGs involved in glutamate signaling (C), stress response and Wnt signaling (D) between WT and P23H RGCs

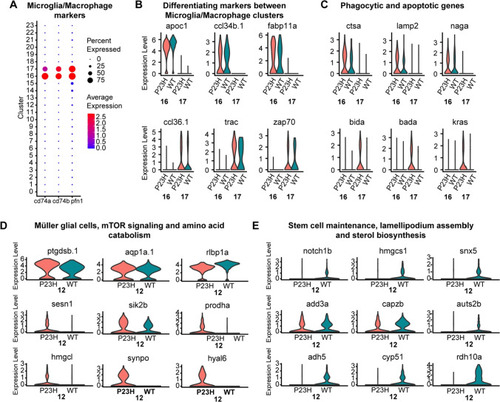
Comparative transcriptomic analysis of microglial/macrophage clusters and Müller glial cells in the zebrafish retina. AC Microglia/Macrophages; D, E Müller glial cells. A Dot plot showing the specific enrichment of canonical markers cd74a and cd74b, as well as the non-canonical marker pfn1 in the microglia/macrophage cell clusters. B Violin plots showing the expression of cluster-specific markers between the two microglial/macrophage clusters (16 and 17). C Violin plot showing the expression of increased phagocytic and apoptotic markers in P23H microglia/macrophages. D Violin plots showing the specific enrichment of canonical Müller glial cell markers as well as changes in DEGs involved in mTOR signaling and amino acid catabolism. E Violin plots showing the decreased levels of DEGs involved in stem cell maintenance, lamellipodium assembly and sterol biosynthesis in P23H Müller glia

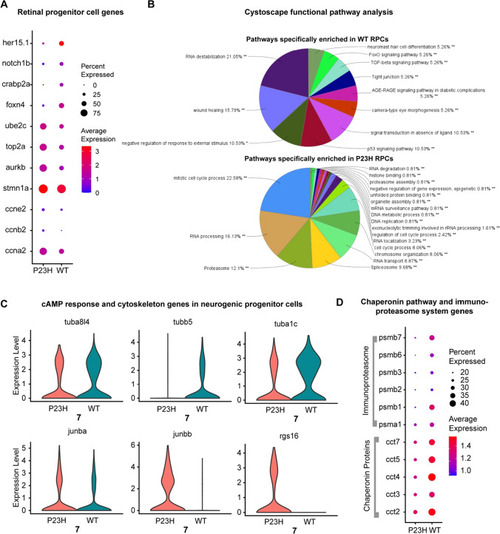
Retinal progenitor cells (RPCs) are enriched in the RP model whereas a neurogenic progenitor cell (NPCs) cluster was identified in both WT and P23H. A, B RPCs; C, D NPCs. A Dot plot showing the expression level and the percentage of cells expressing WT (her 15.1, notch1b, crabp2a, foxn4) and P23H specific (ube2c, top2a, aurkb) RPC markers. B Cytoscape functional pathway analysis pie charts showing the functional pathways that are specifically enriched in WT vs. P23H RPCs. C Violin plots showing changes in DEGs involved in cAMP response and cytoskeleton structure between WT and P23H NPCs. D Dot plot showing the changes in expression level and percentage of cells expressing DEGs involved in the chaperonin pathway and immunoproteasome system in WT and P23H NPCs

Acknowledgments
This image is the copyrighted work of the attributed author or publisher, and ZFIN has permission only to display this image to its users. Additional permissions should be obtained from the applicable author or publisher of the image. Full text @ Cell. Mol. Life Sci.