
IMAGE
Fig. 6
- ID
- ZDB-IMAGE-231121-36
- Publication
- Santhanam et al., 2023 - Molecular basis of retinal remodeling in a zebrafish model of retinitis pigmentosa
- All Figures
- Figures for Santhanam et al., 2023
Image
|
Figure Caption
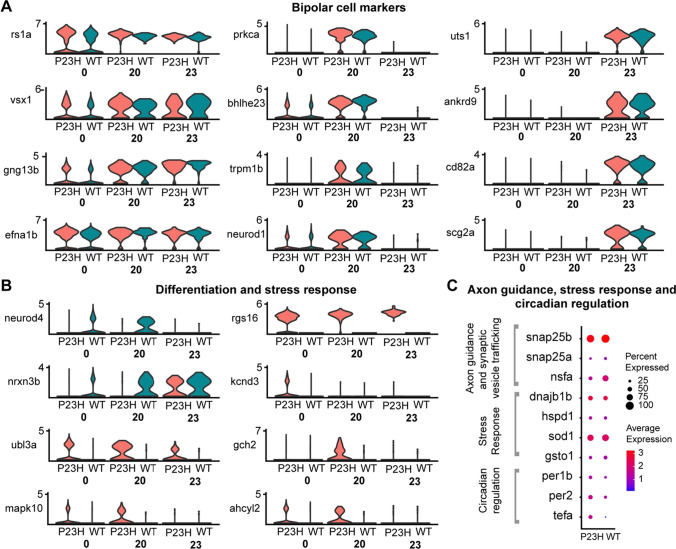
Fig. 6
Comparative transcriptomic analysis of bipolar cell clusters in the WT-P23H integrated dataset shows evidence of stress and neuronal remodeling in the RP model.
Acknowledgments
This image is the copyrighted work of the attributed author or publisher, and
ZFIN has permission only to display this image to its users.
Additional permissions should be obtained from the applicable author or publisher of the image.
Full text @ Cell. Mol. Life Sci.