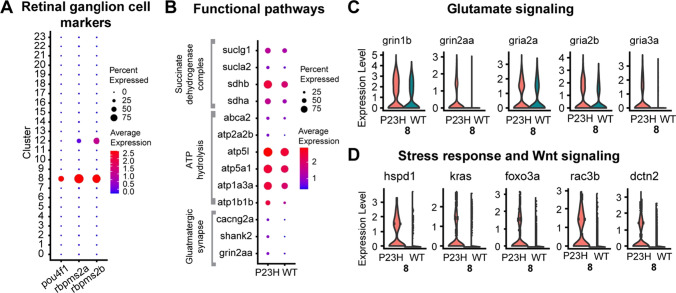
Comparative transcriptomic analysis of retinal ganglion cells in WT-P23H integrated dataset. A Dot plot showing the specific enrichment of canonical markers pou4f1, rbpms2a and rbpms2b in the RGC cluster compared to all other retinal cell types. rbpms2a and rbpms2b are present at lower levels in Müller glial cells (12) as well. B Dot plot showing the expression level and the percentage of cells expressing DEGs involved in different functional pathways between WT and P23H. C, D Violin plots showing increased levels of expression of DEGs involved in glutamate signaling (C), stress response and Wnt signaling (D) between WT and P23H RGCs
Acknowledgments
This image is the copyrighted work of the attributed author or publisher, and
ZFIN has permission only to display this image to its users.
Additional permissions should be obtained from the applicable author or publisher of the image.
Full text @ Cell. Mol. Life Sci.
Your Input Welcome
Thank you for submitting comments. Your input has been emailed to ZFIN curators who may contact you if
additional information is required.
Oops. Something went wrong. Please try again later.