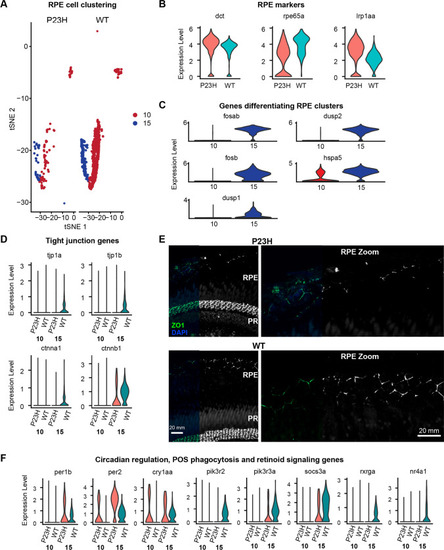
RPE transcriptome is altered in the RP model. A tSNE map showing the proportions of RPE cells found in the P23H and WT retinal samples. B Violin plots showing levels of expression of canonical RPE marker genes in WT and P23H RPE cells. C Violin plots showing expression levels of DEGs differentiating RPE clusters 10 and 15. D Violin plots showing expression levels of genes involved in tight junctions in WT and P23H RPE. E Immuno-fluorescent labeling of tight junction protein ZO1 in retina of adult P23H and WT zebrafish. The layer of retinal pigmented epithelium (RPE) is at the top. Additional strong ZO1 labeling below the photoreceptor inner segments (PR) is the outer limiting membrane formed by Müller cell end-feet tight junctions. Right panels show magnified view of ZO1 labeling in the RPE. Scale bars in WT apply to both WT and P23H. F Violin plots showing levels of expression of DEGs including those involved in circadian regulation, POS phagocytosis and retinoid signaling in WT and P23H RPE cells
|
