
- Title
-
Colonization of larval zebrafish (Danio rerio) with adherent-invasive Escherichia coli prevents recovery of the intestinal mucosa from drug-induced enterocolitis
- Authors
- Flores, E., Dutta, S., Bosserman, R., van Hoof, A., Krachler, A.-.M.
- Source
- Full text @ mSphere
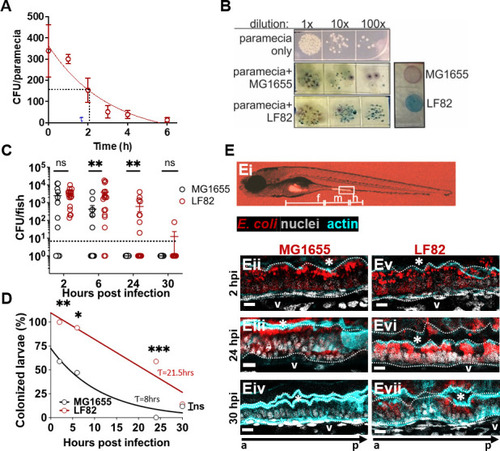
AIEC LF82 colonizes the larval zebrafish intestine better than MG1655. ( |
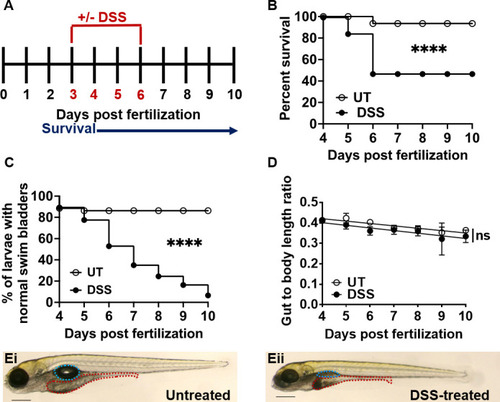
Larval zebrafish treated with 0.5% DSS have decreased survival and intestinal growth rates. ( |
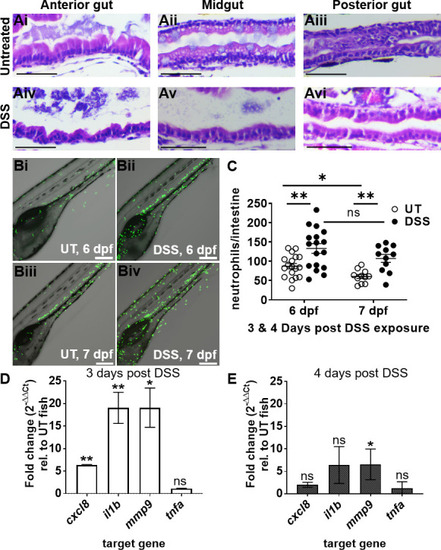
DSS causes intestinal epithelial damage and inflammation consistent with enterocolitis. ( |
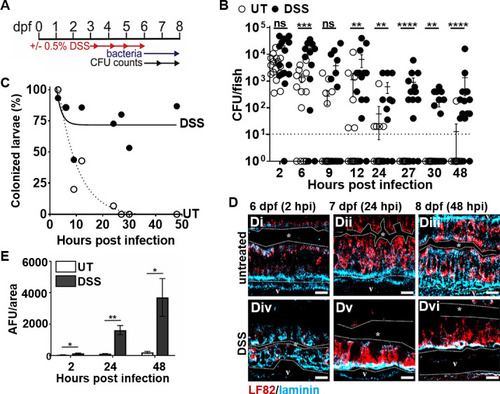
Pre-existing intestinal inflammation enhances the colonization and invasion of AIEC LF82. ( |
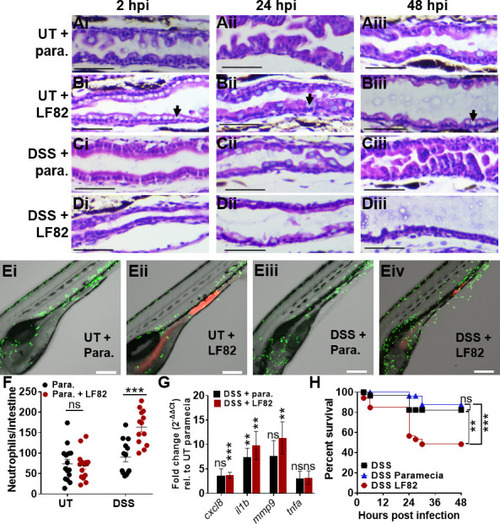
AIEC LF82 exacerbates intestinal inflammation in DSS-treated larvae. ( |
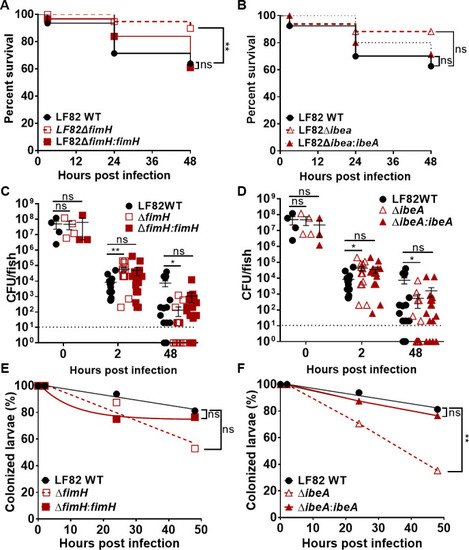
Effects of |

Deletion of |
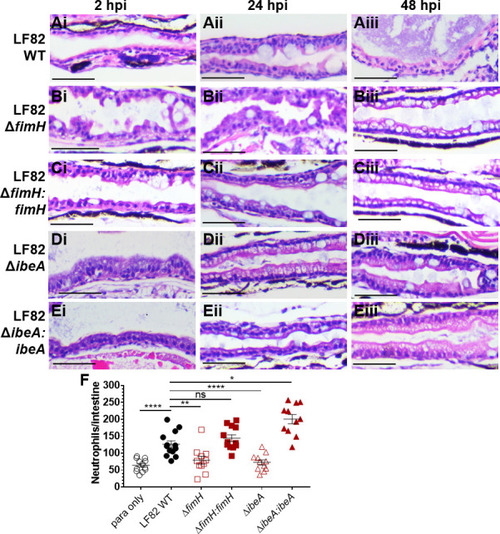
Deletion of |