IMAGE

Fig 2

ID
ZDB-IMAGE-231221-32
Source
Figures for Flores et al., 2023
Image
Figure Caption

Fig 2

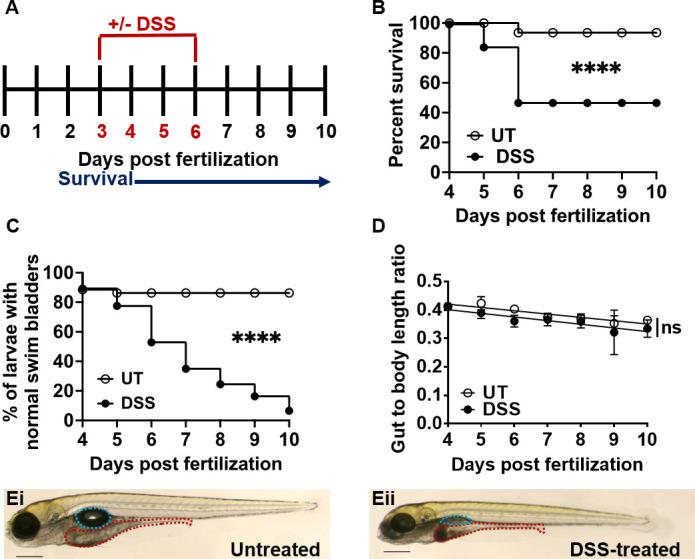
Larval zebrafish treated with 0.5% DSS have decreased survival and intestinal growth rates. (A) Schematic outlining timeline of DSS administration (red, 3–6 dpf) and survival experiments (blue, 1–7 days post exposure). (B) Survival of larvae administered 0.5% DSS (black circles) relative to untreated (UT) controls (empty circles). Data were analyzed using a Kaplan-Meier plot and Mantel-Cox test; ****, P ≤ 0.0001, n = 20. (C) Quantification of swim bladder defects in UT or DSS-treated larvae. Group differences were analyzed using Mantel-Cox test; ****, P ≤ 0.0001, n = 20. (D) Gut-to-body length ratio was analyzed by linear regression; ns = not statistically significant. Data are means ± SEM from n = 20. (E) Representative images of untreated (Ei) and DSS-treated (Eii) larvae at 6 dpf (3 days post DSS exposure), with the swim bladder (teal) and the intestine (red) outlined. Scale bar = 0.3 mm.

Acknowledgments
This image is the copyrighted work of the attributed author or publisher, and ZFIN has permission only to display this image to its users. Additional permissions should be obtained from the applicable author or publisher of the image. Full text @ mSphere