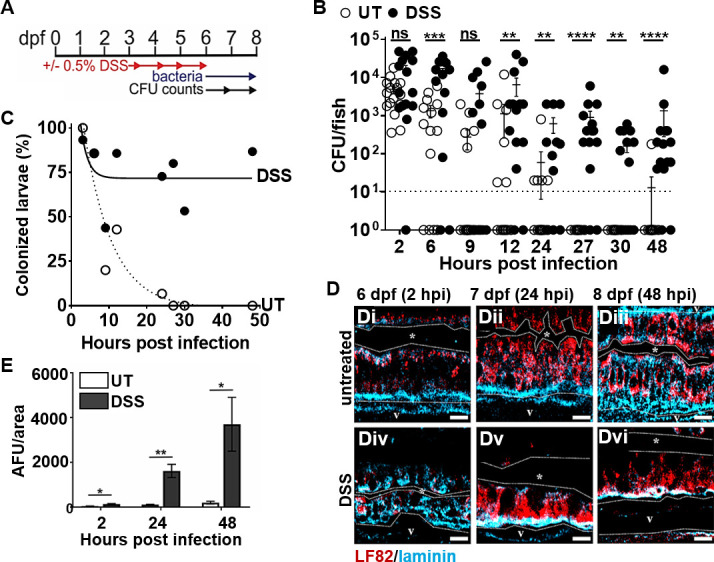
Pre-existing intestinal inflammation enhances the colonization and invasion of AIEC LF82. (A) Timeline of DSS administration, infection of larvae, and sampling for CFU counts. (B) Quantification of LF82 CFUs per larvae with and without DSS treatment, n ≥17; fish with CFU below the detection limit (10 CFU/fish, dashed line) were annotated as 1 CFU. (C) Colonized larvae (%) are percentage of fish with a burden of AIEC above the detection limit; non-linear regression first-order decay, ROUT outlier test with Q = 0.2%. (D) LF82 (red) in the mid-intestine of UT (Di–iii) and DSS-treated (Div–vi) larvae relative to the basement membrane (blue) from 2 to 48 hpi or 6–8 dpf. The dotted white line outlines the intestinal epithelium and separates it from the lumen, indicated by *, and the blood vessel below the basement membrane (V). Scale bars = 10 µm. (E) Quantification of red fluorescence intensity (AFU) (representing AIEC) in the vasculature (V) at 2, 24, and 48 hpi, n = 6; *, P ≤ 0.05; **, P ≤ 0.01; ***, P ≤ 0.001; ****, P ≤ 0.0001; ns, not statistically significant.
Acknowledgments
This image is the copyrighted work of the attributed author or publisher, and
ZFIN has permission only to display this image to its users.
Additional permissions should be obtained from the applicable author or publisher of the image.
Full text @ mSphere
Your Input Welcome
Thank you for submitting comments. Your input has been emailed to ZFIN curators who may contact you if
additional information is required.
Oops. Something went wrong. Please try again later.