- Title
-
Loss-of-function of zebrafish cdt1 causes retarded body growth and underdeveloped gonads resembling human Meier-Gorlin syndrome
- Authors
- He, Y., Wang, Y., Zhu, Y., Lo, L.J.
- Source
- Full text @ J. Zhejiang Univ. Sci. B
|
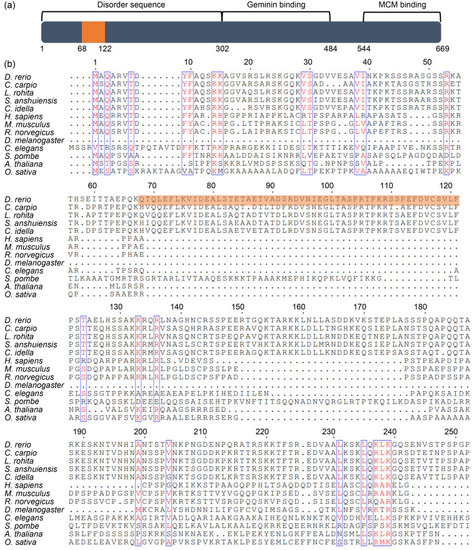
A unique N-terminal found in zebrafish cell division cycle 10 (Cdc10)-dependent transcript 1 (Cdt1), specific to bony fishes. (a) Functional-domain prediction of zebrafish Cdt1 protein. The grey box represents Cdt1 protein; numbers depict amino acids. The 53 unique amino acids in the N-terminal domain are boxed in orange. (b) Multiple alignment of Cdt1 protein sequences obtained from thirteen organisms including: zebrafish (Danio rerio), four species in the Cypriniformes order (Cyprinus carpio, Labeo rohita, Sinocyclocheilus anshuiensis, and Ctenopharyngodon idella), human (Homo sapiens), mouse (Mus musculus), rat (Rattus norvegicus), fruitfly (Drosophila melanogaster), worm (Caenorhabditis elegans), fission yeast (Schizosaccharomyces pombe), thale cress (Arabidopsis thaliana), and rice (Oryza sativa), at N-termini. Red text: similarity within a group; Blue box: similarity across groups; Dots: gaps. |
|
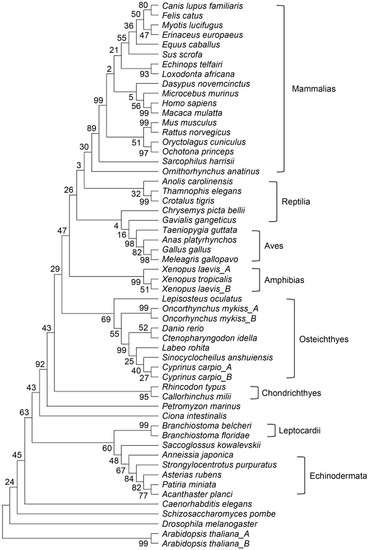
Phylogenetic tree-derived cladogram of cell division cycle 10 (Cdc10)-dependent transcript 1 (Cdt1) at full length, constructed using 56 Cdt1 protein sequences obtained from 52 organisms (listed in Materials and methods) using MEGA7. Length of line represents evolutionary distance. Number represents bootstrap value, an indication of distance reliability (Bootstrap value of >70 means reliable distance predicted). |
|
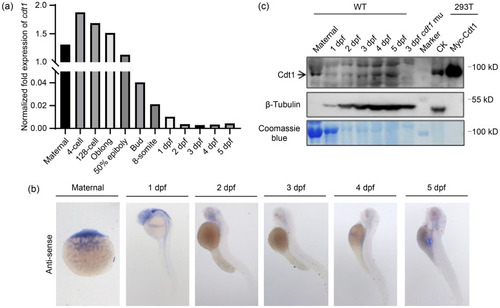
Expression of cdt1 in zebrafish. (a) Quantitative real-time polymerase chain reaction (qPCR) analysis of expression levels of the cell division cycle 10 (Cdc10)-dependent transcript 1 (cdt1)messenger RNA (mRNA) in maternal, 4-cell stage to 5 dpf zebrafish embryos. (b) Representative whole-mount in situ hybridization (WISH) images showing expression patterns of cdt1 mRNA in maternal and 1 to 5 dpf zebrafish embryos. (c) Western blot analysis of expression levels of Cdt1 protein in maternal and 1 to 5 dpf zebrafish embryos. Top panel: Cdt1 antibody; middle panel: β-tubulin antibody; bottom panel: Coomassie blue staining. Negative control: cdt1 mutant (mu); positive control: Myc-Cdt1 overexpression in 293T cells; CK: empty vector; dpf: days post fertilization; WT: wild type. |
|
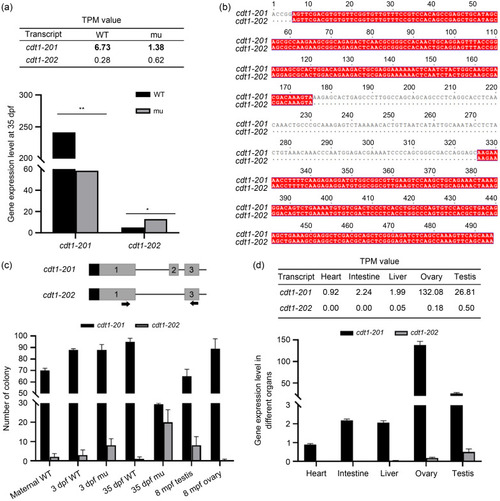
Transcript cell division cycle 10 (Cdc10)-dependent transcript 1 (cdt1) -202 is barely detectable in wild type (WT) but increases in cdt1-201 mutant. (a) Expression levels of cdt1-201 and cdt1-202 transcripts in WT vs. mutant (mu) fries, obtained by RNA sequencing (RNA-seq). The transcripts per million (TPM) values derived from RNA-seq data are shown (upper panel). (b) Alignment of cdt1-201 and cdt1-202 reverse transcription-polymerase chain reaction (RT-PCR) products amplified by primers on exon 1 and exon 3. (c) Expression levels of cdt1-201 and cdt1-202 transcripts in WT vs. mu embryos or fries, WT testis, and WT ovary, obtained by RNA reverse transcription followed by single-colony PCR. Positions of primers are indicated. (d) Expression levels of cdt1-201 and cdt1-202 transcripts in WT organs, obtained by RNA-seq. The TPM values derived from RNA-seq data are shown in tables (upper panel). Data are expressed as mean±standard deviation (SD), n=3 to 10 based on specific tissue size (e.g., three fishes vs. ten hearts). * P<0.05, ** P<0.01, two-tailed t-test. dpf: days post fertilization; mpf: months post fertilization. EXPRESSION / LABELING:
PHENOTYPE:
|
|
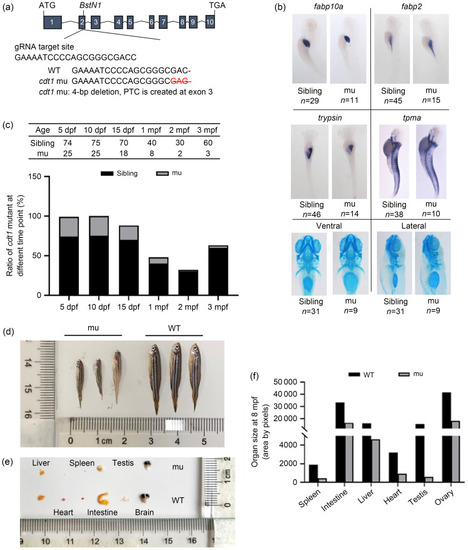
Zebrafish cell division cycle 10 (Cdc10)-dependent transcript 1 (cdt1)-201 mutant is viable but suffers from growth retardation and infertile. (a) Schematic diagram depicting generation of the cdt1-201 mutant (mu) with guide RNA (gRNA) targeting of exon 2 of cdt1-201. (b) Expression of molecular markers from the three germ layers in 5 dpf wild type (WT) siblings (left panel) and mutant (mu) (right panel). Fraction represents number of observed phenotypes/total embryos scored. (c) Table shows the actual numbers of viable siblings and mutants (mu) scored from 5 dpf to 3 mpf. Bar chart shows the survival scores (%) of mutant from 5 dpf to 3 mpf. (d, e) Comparison of 8 mpf WT and mutant (males) in overall body size and size of various major organs including liver, heart, spleen, intestine, testis, and brain. Scale is in cm. Sample number in each group is three. (f) The mean area of each organ is tabulated into a bar graph. Standard deviation is not calculated due to too small sample size (n=3, for each organ). dpf: days post fertilization; mpf: months post fertilization. |

