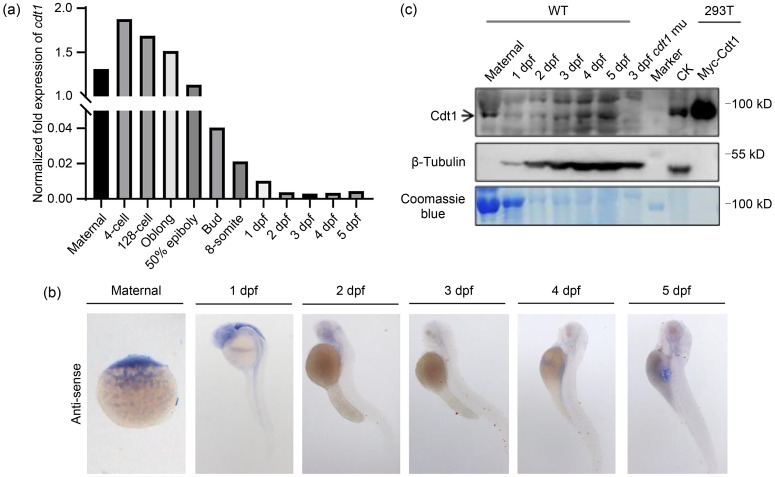
Fig. 3 Expression of cdt1 in zebrafish. (a) Quantitative real-time polymerase chain reaction (qPCR) analysis of expression levels of the cell division cycle 10 (Cdc10)-dependent transcript 1 (cdt1)messenger RNA (mRNA) in maternal, 4-cell stage to 5 dpf zebrafish embryos. (b) Representative whole-mount in situ hybridization (WISH) images showing expression patterns of cdt1 mRNA in maternal and 1 to 5 dpf zebrafish embryos. (c) Western blot analysis of expression levels of Cdt1 protein in maternal and 1 to 5 dpf zebrafish embryos. Top panel: Cdt1 antibody; middle panel: β-tubulin antibody; bottom panel: Coomassie blue staining. Negative control: cdt1 mutant (mu); positive control: Myc-Cdt1 overexpression in 293T cells; CK: empty vector; dpf: days post fertilization; WT: wild type.
Image
Figure Caption
Figure Data
Acknowledgments
This image is the copyrighted work of the attributed author or publisher, and
ZFIN has permission only to display this image to its users.
Additional permissions should be obtained from the applicable author or publisher of the image.
Full text @ J. Zhejiang Univ. Sci. B

